Mastering Your CRM Marketing Dashboard Setup: A Comprehensive Guide

Mastering Your CRM Marketing Dashboard Setup: A Comprehensive Guide
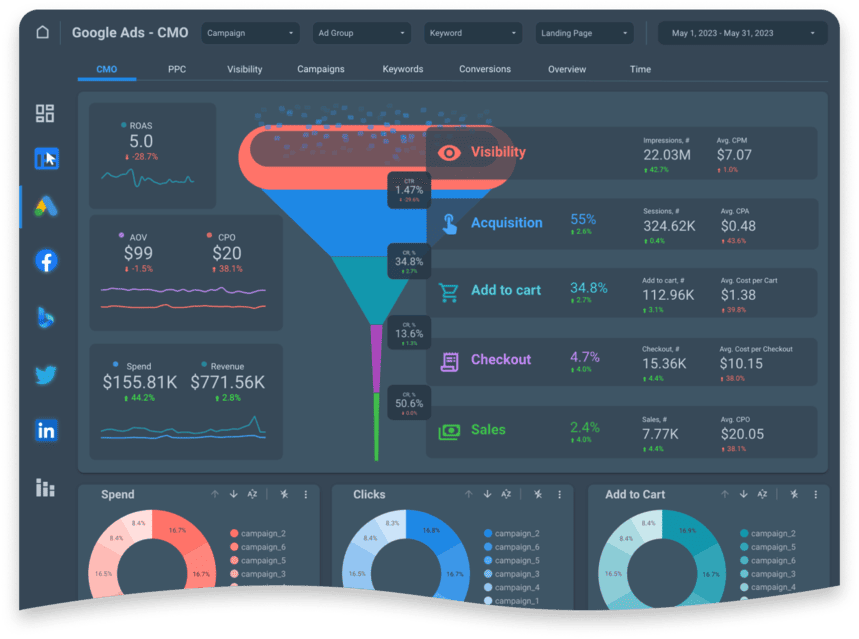
In today’s fast-paced business environment, data is king. And when it comes to understanding your customers, optimizing marketing campaigns, and driving revenue, your CRM (Customer Relationship Management) system is your kingdom. But a powerful CRM is only as effective as the insights it provides. That’s where your CRM marketing dashboard comes in. It’s the central hub where you visualize key metrics, track performance, and make data-driven decisions. This comprehensive guide will walk you through everything you need to know about setting up a CRM marketing dashboard that truly empowers your marketing efforts.
Why a CRM Marketing Dashboard is Essential
Before we dive into the setup, let’s explore why a well-designed CRM marketing dashboard is so crucial. Think of it as the control panel for your marketing operations. It provides a real-time, at-a-glance view of your most important marketing KPIs (Key Performance Indicators). This allows you to:
- Monitor Campaign Performance: See how your campaigns are performing in terms of leads generated, conversions, and ROI.
- Identify Trends: Spot patterns and trends in customer behavior, campaign effectiveness, and market dynamics.
- Optimize Strategies: Make informed decisions about resource allocation, campaign adjustments, and future marketing initiatives.
- Improve Sales and Marketing Alignment: Ensure that your sales and marketing teams are working in sync towards common goals.
- Enhance Customer Experience: Gain a deeper understanding of your customers and personalize their interactions.
Without a proper dashboard, you’re essentially flying blind. You’re relying on hunches and guesswork rather than concrete data. This can lead to wasted resources, missed opportunities, and a general lack of marketing effectiveness.
Key Components of a High-Performing CRM Marketing Dashboard
A successful CRM marketing dashboard isn’t just about throwing a bunch of charts and graphs onto a screen. It’s about curating the right information, presented in a clear and actionable way. Here are the essential components you should include:
1. Lead Generation Metrics
Lead generation is the lifeblood of any marketing effort. Your dashboard should track the following lead-related metrics:
- Total Leads Generated: The overall number of leads captured during a specific period.
- Lead Source: Identify the channels driving the most leads (e.g., website forms, social media, paid advertising).
- Lead Conversion Rate: The percentage of leads that convert into qualified leads or customers.
- Cost Per Lead (CPL): The cost associated with acquiring each lead.
- Lead Velocity Rate: The rate at which leads are growing over time.
2. Website Traffic Analytics
Your website is often the first point of contact for potential customers. Your dashboard should incorporate website traffic data to understand how visitors are interacting with your online presence:
- Website Traffic: Overall website visits, unique visitors, and page views.
- Traffic Sources: Identify the sources of your website traffic (e.g., organic search, direct traffic, referral traffic).
- Bounce Rate: The percentage of visitors who leave your website after viewing only one page.
- Conversion Rate: The percentage of website visitors who complete a desired action (e.g., filling out a form, making a purchase).
- Time on Site: The average amount of time visitors spend on your website.
3. Campaign Performance Metrics
Track the performance of your marketing campaigns to assess their effectiveness and make necessary adjustments. Include metrics such as:
- Campaign ROI: Return on investment for each campaign.
- Click-Through Rate (CTR): The percentage of users who click on your ads or links.
- Conversion Rate: The percentage of users who convert after interacting with your campaign.
- Cost Per Conversion (CPC): The cost associated with each conversion.
- Reach and Impressions: The number of people who saw your ads and the number of times your ads were displayed.
4. Sales Pipeline Metrics
Align your marketing efforts with your sales team by tracking sales pipeline metrics. This will give you a better understanding of how marketing contributes to revenue generation:
- Number of Opportunities: The total number of sales opportunities in your pipeline.
- Opportunity Value: The estimated value of each opportunity.
- Conversion Rate: The percentage of opportunities that convert into closed deals.
- Average Deal Size: The average value of closed deals.
- Sales Cycle Length: The average time it takes to close a deal.
5. Customer Segmentation and Behavior
Understanding your customer base is critical for effective marketing. Incorporate metrics related to customer segmentation and behavior:
- Customer Segmentation: Group customers based on demographics, behavior, or purchasing history.
- Customer Lifetime Value (CLTV): The predicted revenue a customer will generate over their relationship with your business.
- Customer Acquisition Cost (CAC): The cost of acquiring a new customer.
- Churn Rate: The percentage of customers who stop doing business with you.
- Customer Satisfaction (CSAT) and Net Promoter Score (NPS): Measures of customer satisfaction and loyalty.
Step-by-Step Guide to Setting Up Your CRM Marketing Dashboard
Now that you know what metrics to track, let’s walk through the process of setting up your CRM marketing dashboard. The specific steps may vary depending on the CRM system you’re using, but the general principles remain the same.
Step 1: Choose Your CRM and Dashboarding Tools
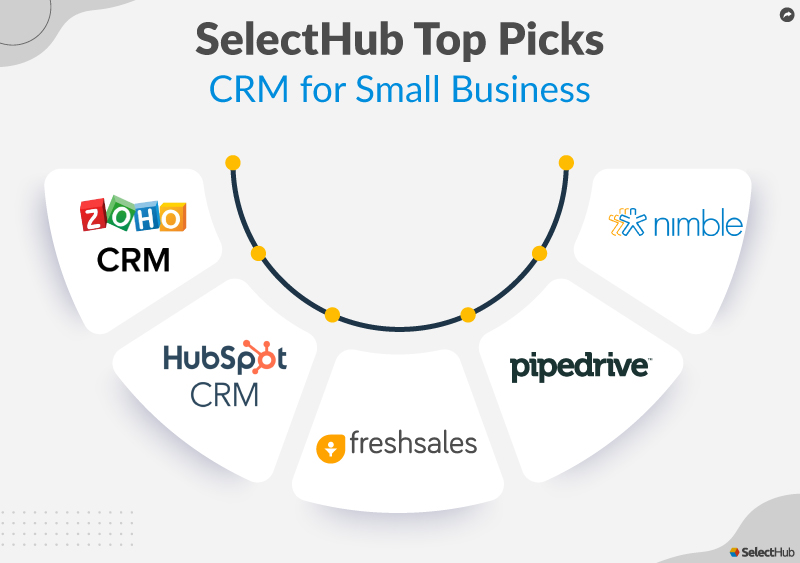
The first step is to select the right tools for the job. If you don’t already have a CRM, research and choose one that aligns with your business needs. Popular CRM systems include:
- Salesforce: A comprehensive CRM platform with robust dashboarding capabilities.
- HubSpot: A user-friendly CRM with powerful marketing automation and reporting features.
- Zoho CRM: A cost-effective CRM with a wide range of features and integrations.
- Microsoft Dynamics 365: A CRM platform integrated with Microsoft’s suite of business applications.
- Pipedrive: A sales-focused CRM with a visual pipeline and easy-to-use reporting.
Many CRM systems have built-in dashboarding features. However, you may need to use a separate dashboarding tool for more advanced visualizations and customization. Popular dashboarding tools include:
- Tableau: A powerful data visualization tool with a wide range of features and integrations.
- Power BI: Microsoft’s business intelligence platform, integrated with the Microsoft ecosystem.
- Google Data Studio: A free and easy-to-use dashboarding tool that integrates with Google services.
- Klipfolio: A cloud-based dashboarding platform with a focus on real-time data visualization.
Step 2: Define Your Key Performance Indicators (KPIs)
Before you start building your dashboard, you need to determine which KPIs are most important to your business goals. This is a crucial step. Consider the following:
- What are your overall marketing objectives? (e.g., increase leads, drive sales, improve customer retention)
- What specific metrics will help you track progress towards these objectives?
- What data is available in your CRM and other integrated systems?
- Who will be using the dashboard, and what information do they need?
Once you’ve identified your KPIs, make sure they are SMART: Specific, Measurable, Achievable, Relevant, and Time-bound. This will ensure that your dashboard provides actionable insights.
Step 3: Connect Your Data Sources
Your CRM will likely be the primary data source for your dashboard. However, you may also need to connect to other data sources, such as:
- Website Analytics (e.g., Google Analytics)
- Social Media Platforms (e.g., Facebook, Twitter, LinkedIn)
- Email Marketing Platforms (e.g., Mailchimp, Constant Contact)
- Advertising Platforms (e.g., Google Ads, Facebook Ads)
- Sales Data from other systems
Most CRM and dashboarding tools offer integrations with these data sources. Follow the instructions provided by your tools to connect your data sources and ensure that the data is flowing correctly.
Step 4: Design Your Dashboard Layout
A well-designed dashboard is easy to read and understand. Consider the following design principles:
- Keep it Simple: Avoid clutter and focus on the most important information.
- Use Visualizations Effectively: Choose the right chart types for your data (e.g., bar charts for comparisons, line charts for trends).
- Organize Information Logically: Group related metrics together and arrange them in a clear and intuitive way.
- Use Color and Formatting Wisely: Use color to highlight key trends and patterns, and use formatting to improve readability.
- Ensure Mobile Responsiveness: Make sure your dashboard is accessible and easy to view on mobile devices.
Experiment with different layouts and visualizations until you find a design that works best for you and your team.
Step 5: Build Your Dashboard and Configure Widgets
Now it’s time to build your dashboard. This involves selecting the widgets (charts, graphs, tables) that will display your KPIs. The specific steps will vary depending on the tool you’re using, but the general process is as follows:
- Select a Widget Type: Choose the appropriate widget type for each KPI (e.g., bar chart, line chart, pie chart, table).
- Select Your Data Source: Choose the data source that contains the data for your KPI.
- Configure Your Data: Select the specific fields and metrics you want to display.
- Customize Your Widget: Customize the appearance of your widget (e.g., colors, labels, titles).
- Add Filters and Segmentation: Use filters and segmentation to drill down into your data and gain deeper insights.
Repeat these steps for each KPI you want to track, and arrange the widgets in a logical layout.
Step 6: Test and Refine Your Dashboard
Once you’ve built your dashboard, it’s time to test it. Make sure that the data is accurate, the visualizations are clear, and the dashboard is easy to use. Ask your team to provide feedback and make adjustments as needed.
- Verify Data Accuracy: Double-check that the data displayed in your dashboard matches the data in your CRM and other data sources.
- Test User Experience: Have team members test the dashboard and provide feedback on its usability.
- Iterate and Improve: Based on feedback, make adjustments to the layout, visualizations, and data displayed.
- Regularly Review and Update: Your dashboard should be a living document. Review it regularly and update it as your business needs evolve.
Step 7: Train Your Team and Establish a Reporting Cadence
Your dashboard is only useful if your team knows how to use it. Provide training on how to interpret the data, use the filters, and make data-driven decisions. Establish a regular reporting cadence to ensure that the dashboard is used effectively.
- Provide Training: Train your team on how to use the dashboard and interpret the data.
- Establish a Reporting Schedule: Determine how often you will review the dashboard (e.g., daily, weekly, monthly).
- Set Actionable Goals: Define specific goals based on the dashboard data.
- Foster a Data-Driven Culture: Encourage your team to use the dashboard to inform their decisions and track progress.
Advanced CRM Marketing Dashboard Strategies
Once you’ve mastered the basics, you can explore more advanced strategies to enhance your CRM marketing dashboard:
1. Predictive Analytics
Leverage predictive analytics to forecast future trends and make proactive decisions. This involves using statistical techniques and machine learning to analyze historical data and predict future outcomes. For example, you can use predictive analytics to:
- Predict Lead Conversion Rates: Identify which leads are most likely to convert into customers.
- Forecast Sales Revenue: Estimate future sales revenue based on pipeline data.
- Identify Customer Churn Risk: Predict which customers are at risk of churning.
2. Personalized Dashboards
Customize dashboards for different users or teams based on their roles and responsibilities. This ensures that each user has access to the information they need to make informed decisions. For example:
- Sales Team Dashboard: Focus on sales pipeline metrics, lead conversion rates, and deal sizes.
- Marketing Team Dashboard: Focus on campaign performance, lead generation, and website traffic.
- Executive Dashboard: Provide a high-level overview of key performance indicators.
3. Automated Alerts and Notifications
Set up automated alerts and notifications to be informed of significant changes in your data. This can help you respond quickly to issues or opportunities. For example:
- Receive alerts when lead generation drops.
- Be notified when a campaign’s ROI falls below a certain threshold.
- Get alerts when a customer is at risk of churning.
4. Integration with Marketing Automation Platforms
Integrate your CRM dashboard with your marketing automation platform to gain a holistic view of your marketing efforts. This will allow you to track the entire customer journey, from initial contact to conversion and beyond. This integration unlocks a deeper understanding of customer interactions and campaign effectiveness.
Common Pitfalls to Avoid
While setting up a CRM marketing dashboard can be incredibly beneficial, there are some common pitfalls to avoid:
- Collecting Too Much Data: Avoid overwhelming your dashboard with unnecessary metrics. Focus on the KPIs that are most relevant to your business goals.
- Ignoring Data Accuracy: Regularly verify the accuracy of your data to ensure that your dashboard provides reliable insights.
- Failing to Train Your Team: Provide adequate training to your team so they can effectively use the dashboard and interpret the data.
- Not Regularly Reviewing and Updating: Your business needs will evolve, so make sure to regularly review and update your dashboard to keep it relevant.
- Not Integrating with Other Systems: Failing to integrate with other crucial systems, such as email marketing platforms or advertising platforms, can limit the scope and effectiveness of your dashboard.
Conclusion: Unleash the Power of Your Data
Setting up a CRM marketing dashboard is a transformative step towards data-driven marketing. By tracking the right metrics, visualizing your data effectively, and making informed decisions, you can optimize your campaigns, improve customer relationships, and drive revenue growth. Remember to start with the basics, focus on your key objectives, and continuously refine your dashboard to meet your evolving needs. Embrace the power of your data and unlock the full potential of your marketing efforts.
By following these steps and avoiding the common pitfalls, you can create a CRM marketing dashboard that empowers your marketing team and drives exceptional results. So, take the plunge, build your dashboard, and start making data-driven decisions today!


