Mastering the CRM Marketing Dashboard: Your Guide to Data-Driven Success
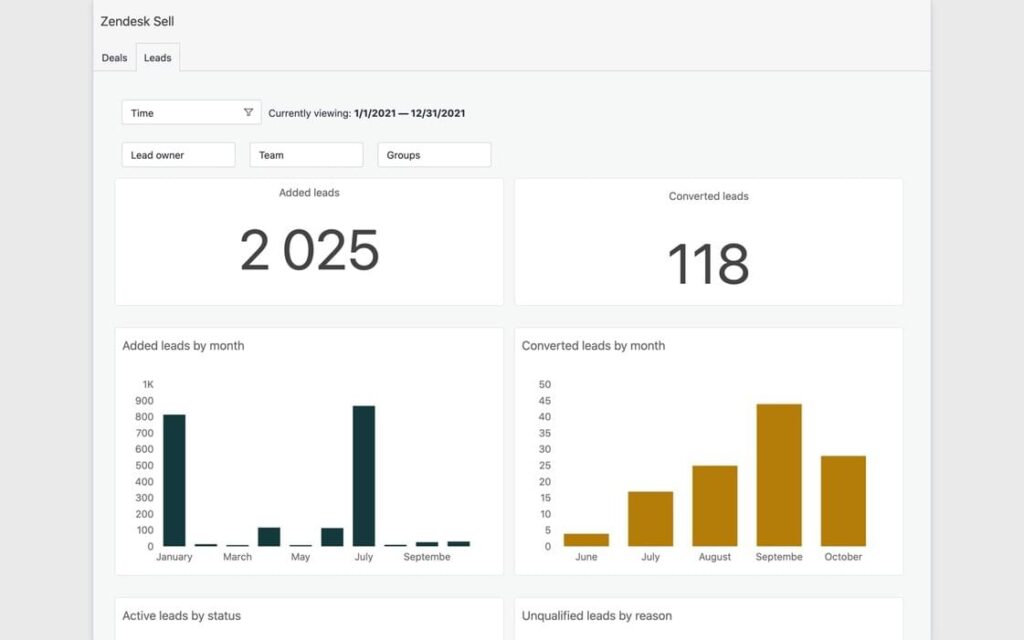
In today’s hyper-competitive business landscape, understanding your customers is no longer a luxury; it’s a necessity. And in the realm of customer relationship management (CRM), the marketing dashboard reigns supreme. It’s the command center, the cockpit, the crystal ball – whatever metaphor you prefer – that provides a comprehensive view of your marketing efforts, customer interactions, and, ultimately, your bottom line. This article will delve deep into the world of CRM marketing dashboards, equipping you with the knowledge to harness their power and drive tangible results.
What is a CRM Marketing Dashboard?
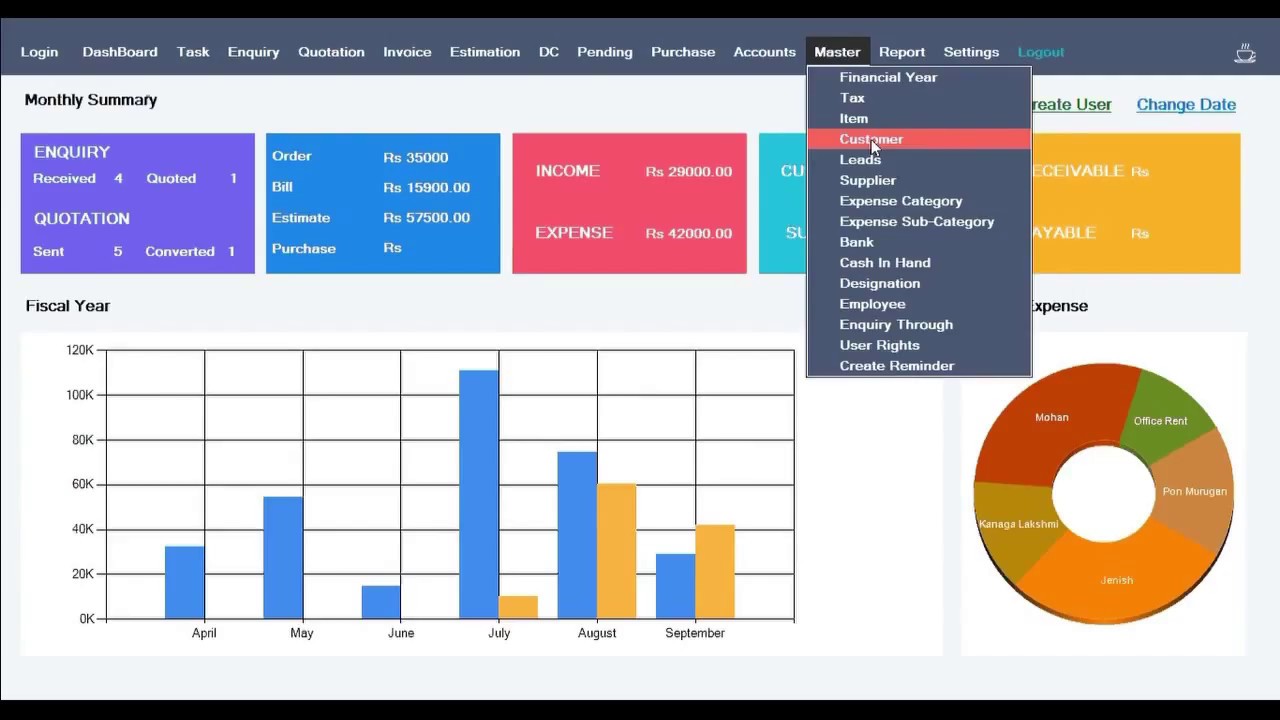
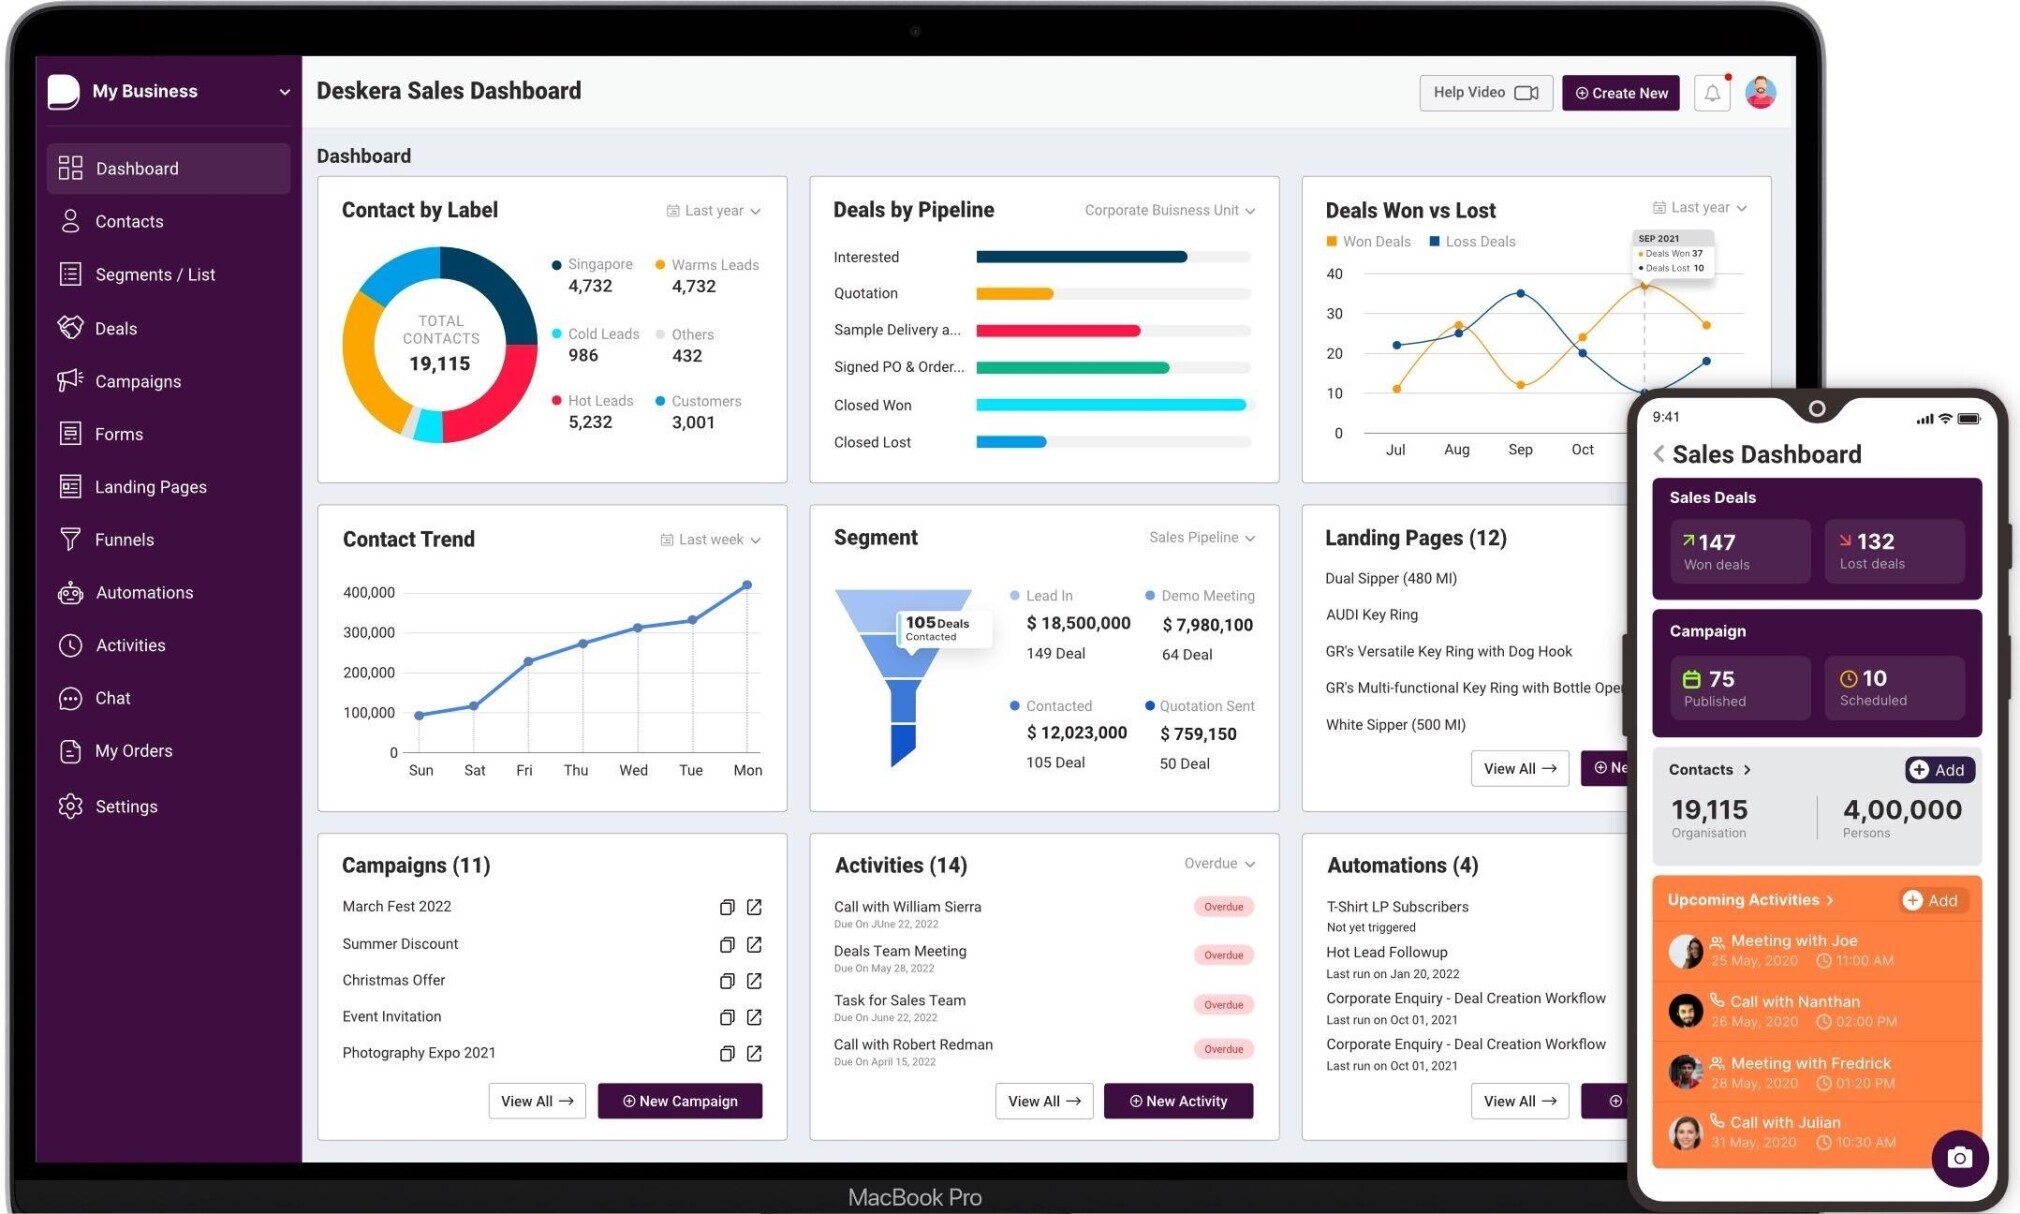
At its core, a CRM marketing dashboard is a visual representation of your marketing data, pulled directly from your CRM system. It’s a centralized hub that displays key performance indicators (KPIs) in an easy-to-understand format, often using charts, graphs, and tables. This allows marketers to quickly assess the effectiveness of their campaigns, identify areas for improvement, and make data-driven decisions.
Think of it as your marketing team’s personal weather station. It provides real-time updates on the current marketing climate, helping you navigate the storms and capitalize on the sunny days. Without a dashboard, you’re essentially flying blind, relying on gut feelings and guesswork. With one, you have the tools to steer your marketing efforts towards success.
Why is a CRM Marketing Dashboard Important?
The benefits of a well-designed CRM marketing dashboard are numerous. Here are some of the key advantages:
- Enhanced Decision-Making: Data visualization allows for quicker and more informed decisions. Instead of sifting through spreadsheets, you can instantly see trends and patterns.
- Improved Campaign Performance: By monitoring KPIs, you can identify underperforming campaigns and make adjustments to optimize them.
- Increased ROI: By focusing on what works, you can maximize your return on investment (ROI) and allocate resources more efficiently.
- Better Customer Understanding: Dashboards provide insights into customer behavior, preferences, and needs, allowing you to personalize your marketing efforts.
- Streamlined Reporting: Easily generate reports for stakeholders, showcasing your marketing achievements and progress.
- Increased Efficiency: Automate data collection and analysis, saving time and freeing up your team to focus on strategic initiatives.
In essence, a CRM marketing dashboard empowers you to move beyond intuition and embrace a data-driven approach to marketing. It transforms raw data into actionable insights, enabling you to make smarter decisions, improve campaign performance, and ultimately, drive business growth.
Key Metrics to Track on Your CRM Marketing Dashboard
The specific metrics you track will depend on your business goals and marketing strategies. However, some KPIs are universally important for measuring marketing performance. Here are some of the most crucial metrics to include on your CRM marketing dashboard:
1. Website Traffic and Engagement
- Website Traffic: The total number of visitors to your website.
- New vs. Returning Visitors: This helps you understand customer loyalty and the effectiveness of your retention strategies.
- Bounce Rate: The percentage of visitors who leave your website after viewing only one page. A high bounce rate can indicate issues with your website design, content, or user experience.
- Pages per Session: The average number of pages a visitor views during a single session.
- Average Session Duration: The average amount of time visitors spend on your website.
- Conversion Rate: The percentage of visitors who complete a desired action, such as filling out a form or making a purchase.
2. Lead Generation
- Number of Leads: The total number of new leads generated.
- Lead Source: Track where your leads are coming from (e.g., organic search, social media, paid advertising).
- Lead Conversion Rate: The percentage of leads who convert into customers.
- Cost per Lead (CPL): The cost of acquiring a single lead.
- Lead Quality: Assess the quality of your leads based on factors like demographics, behavior, and engagement.
3. Sales Performance
- Sales Revenue: The total revenue generated from sales.
- Number of Sales: The total number of sales transactions.
- Conversion Rate: The percentage of leads who convert into customers.
- Average Deal Size: The average value of each sale.
- Customer Acquisition Cost (CAC): The cost of acquiring a new customer.
- Customer Lifetime Value (CLTV): The predicted revenue a customer will generate over their relationship with your business.
4. Email Marketing Performance
- Open Rate: The percentage of emails that are opened.
- Click-Through Rate (CTR): The percentage of recipients who click on links in your emails.
- Conversion Rate: The percentage of recipients who complete a desired action after clicking on a link in your email.
- Unsubscribe Rate: The percentage of recipients who unsubscribe from your email list.
- Bounce Rate: The percentage of emails that are not delivered.
5. Social Media Performance
- Follower Growth: The rate at which your social media following is growing.
- Engagement Rate: The percentage of your audience that interacts with your content (e.g., likes, comments, shares).
- Reach: The number of unique users who have seen your content.
- Website Traffic from Social Media: The number of visitors to your website who came from social media platforms.
- Social Media Conversion Rate: The percentage of social media users who complete a desired action.
Remember that the specific metrics you track should align with your overall marketing goals. Regularly review your dashboard and adjust your KPIs as needed to ensure they remain relevant and effective.
Building Your CRM Marketing Dashboard: A Step-by-Step Guide
Creating a powerful CRM marketing dashboard doesn’t have to be a daunting task. Here’s a step-by-step guide to help you build a dashboard that provides valuable insights and drives results:
1. Define Your Goals and Objectives
Before you start building your dashboard, it’s crucial to define your marketing goals and objectives. What do you want to achieve with your marketing efforts? Are you looking to increase website traffic, generate more leads, improve sales, or enhance customer engagement? Your goals will determine the metrics you need to track on your dashboard.
For example, if your goal is to increase website traffic, you’ll want to track metrics like website traffic, bounce rate, and pages per session. If your goal is to generate more leads, you’ll want to track metrics like lead generation, lead source, and lead conversion rate.
2. Choose Your CRM and Dashboard Software
The next step is to choose the right CRM and dashboard software for your needs. Many CRM systems offer built-in dashboard capabilities, while others integrate with third-party dashboard tools. Consider the following factors when making your selection:
- Functionality: Does the software offer the metrics and visualizations you need?
- Ease of Use: Is the software user-friendly and easy to navigate?
- Integrations: Does the software integrate with your existing marketing tools and platforms?
- Scalability: Can the software handle your current data volume and scale as your business grows?
- Cost: What is the pricing structure, and does it fit within your budget?
Some popular CRM systems with robust dashboard features include Salesforce, HubSpot, and Zoho CRM. Popular dashboard tools that integrate with various CRM systems include Google Data Studio (now Looker Studio), Tableau, and Power BI.
3. Connect Your Data Sources
Once you’ve chosen your software, you’ll need to connect your data sources to your dashboard. This typically involves integrating your CRM system with your other marketing tools, such as your website analytics platform, email marketing software, and social media platforms. Most dashboard software offers pre-built connectors for popular marketing platforms, making the integration process relatively straightforward.
Make sure that your data is clean and accurate. Data quality is critical for generating meaningful insights. Regularly review your data sources and ensure that your data is properly formatted and free of errors.
4. Select Your KPIs and Metrics
Based on your goals and objectives, select the KPIs and metrics you want to track on your dashboard. Prioritize the metrics that are most important for measuring your marketing performance. Keep in mind that you don’t need to track every single metric; focus on the ones that provide the most valuable insights.
Consider grouping related metrics together to make your dashboard easier to understand. For example, you could group all website traffic metrics together, all lead generation metrics together, and so on.
5. Design Your Dashboard
The design of your dashboard is crucial for its usability. Choose a clear and concise layout that’s easy to read and understand. Use charts, graphs, and tables to visualize your data effectively. Here are some design tips:
- Keep it Simple: Avoid clutter and focus on the most important information.
- Use Visualizations Effectively: Choose the right type of chart or graph for each metric. For example, use line charts to show trends over time, bar charts to compare different categories, and pie charts to show proportions.
- Use Color Strategically: Use color to highlight key information and make your dashboard more visually appealing.
- Provide Context: Add labels, titles, and descriptions to your charts and graphs to provide context and make it easier for users to understand the data.
- Consider Your Audience: Design your dashboard with your target audience in mind. Tailor the metrics and visualizations to their needs and preferences.
6. Customize and Personalize Your Dashboard
Most dashboard software allows you to customize and personalize your dashboard to meet your specific needs. You can add filters, segments, and calculations to drill down into your data and gain deeper insights. You can also create custom reports and dashboards for different teams or departments.
Take advantage of these customization options to tailor your dashboard to your specific requirements. Regularly review your dashboard and make adjustments as needed to ensure it remains relevant and effective.
7. Monitor and Analyze Your Data
Once your dashboard is set up, the real work begins: monitoring and analyzing your data. Regularly review your dashboard to track your progress towards your goals. Identify trends, patterns, and anomalies in your data. Use these insights to make data-driven decisions and optimize your marketing efforts.
Don’t be afraid to experiment. Try different strategies and tactics and see what works best. Continuously analyze your data and make adjustments to your campaigns to improve your results.
8. Iterate and Improve
Your CRM marketing dashboard is not a static tool. It should evolve over time as your business grows and your marketing strategies change. Regularly review your dashboard and make adjustments as needed. Add new metrics, remove outdated ones, and refine your visualizations to ensure your dashboard remains relevant and effective.
Gather feedback from your team and stakeholders to identify areas for improvement. Use this feedback to make your dashboard more user-friendly and valuable. The key is to continuously iterate and improve your dashboard to maximize its impact.
Best Practices for Effective CRM Marketing Dashboards
Creating a successful CRM marketing dashboard goes beyond simply displaying data. Here are some best practices to help you build a dashboard that truly drives results:
- Focus on Actionable Insights: Your dashboard should provide insights that you can actually use to improve your marketing performance. Avoid tracking metrics that don’t lead to actionable decisions.
- Keep it Up-to-Date: Ensure that your data is accurate and up-to-date. Set up automated data refresh schedules to keep your dashboard current.
- Make it Accessible: Make your dashboard accessible to the right people within your organization. Share your dashboard with your marketing team, sales team, and other stakeholders who need access to the data.
- Provide Training: Train your team on how to use and interpret the data on your dashboard. This will help them make better decisions and get the most out of the tool.
- Integrate with Other Systems: Integrate your CRM marketing dashboard with your other marketing and sales systems to gain a more holistic view of your business.
- Set up Alerts and Notifications: Set up alerts and notifications to be notified when key metrics change. This will help you stay on top of your marketing performance and quickly identify any issues.
- Regularly Review and Refine: Regularly review your dashboard and make adjustments as needed. Delete any metrics that are no longer relevant and add new ones that are important to your business.
By following these best practices, you can create a CRM marketing dashboard that is a valuable asset for your business. It will help you make better decisions, improve your marketing performance, and ultimately, drive growth.
Advanced CRM Marketing Dashboard Strategies
Once you’ve mastered the basics, you can take your CRM marketing dashboard to the next level with these advanced strategies:
1. Predictive Analytics
Integrate predictive analytics into your dashboard to forecast future trends and anticipate customer behavior. This can involve using machine learning algorithms to analyze your data and identify patterns that can help you predict things like customer churn, sales opportunities, and campaign performance. The ability to anticipate future trends provides a significant advantage in proactive decision-making.
2. Segmentation and Personalization
Use your CRM data to segment your customers based on their demographics, behavior, and preferences. Then, tailor your marketing efforts to each segment. Your dashboard can then track the performance of each segment, providing insights into what resonates most with different customer groups. This personalized approach dramatically increases engagement and conversion rates.
3. A/B Testing and Optimization
Integrate A/B testing results into your dashboard to track the performance of different marketing variations. This allows you to identify which versions of your campaigns, website pages, or email subject lines perform best. Continuous A/B testing and optimization will refine your marketing efforts, leading to improved results over time. The dashboard provides a central place to view and analyze test results, helping you make data-driven decisions about your marketing strategy.
4. Attribution Modeling
Implement attribution modeling to understand how different marketing touchpoints contribute to conversions. This helps you determine which channels and campaigns are most effective at driving sales. By understanding the customer journey, you can optimize your marketing spend and allocate resources to the most impactful channels. Attribution models provide a more nuanced view of marketing effectiveness than simple last-click attribution.
5. Real-Time Data Integration
Integrate real-time data streams into your dashboard to get instant updates on your marketing performance. This is particularly useful for tracking social media engagement, website traffic, and lead generation. Real-time data allows you to respond quickly to changes in customer behavior and adjust your marketing efforts accordingly. It provides a dynamic view of your marketing performance, allowing you to make more informed decisions in the moment.
Choosing the Right CRM Marketing Dashboard Software
Selecting the right CRM marketing dashboard software is critical for success. Here’s a breakdown of key factors to consider when making your choice:
1. Integration Capabilities
Ensure the software integrates seamlessly with your existing CRM, marketing automation, and other relevant tools. Check for pre-built connectors or APIs that allow you to easily import data from various sources. The more integrated your dashboard, the more comprehensive and valuable the insights it will provide. Compatibility is key for data flow.
2. Customization Options
Look for software that allows you to customize the dashboard to your specific needs. This includes the ability to choose your own metrics, create custom reports, and personalize the visualizations. Flexibility is essential to create a dashboard that perfectly aligns with your marketing goals. Ensure you can tailor the dashboard to your unique requirements.
3. User-Friendliness
Choose software that is intuitive and easy to use. The dashboard should be simple to navigate, with clear visualizations and a user-friendly interface. Your team will be more likely to adopt and use the dashboard if it’s easy to understand and interpret. A user-friendly design encourages adoption and maximizes the value of the tool.
4. Reporting and Analytics Features
The software should offer robust reporting and analytics features, including the ability to create custom reports, analyze trends, and generate insights. Look for features like data filtering, segmentation, and the ability to export data in various formats. Comprehensive reporting capabilities are vital for in-depth analysis. Ensure the software provides the data you need in the format you require.
5. Data Visualization Options
The software should provide a variety of data visualization options, such as charts, graphs, and tables. The visualizations should be clear, concise, and easy to understand. Effective data visualization is essential for quickly interpreting data and identifying key trends. The right visualizations make data accessible and actionable.
6. Scalability and Performance
Consider the scalability of the software. As your business grows, your data volume will increase. Ensure the software can handle the increased data volume without performance issues. The system should be able to handle the demands of your growing business. Scalability ensures the dashboard remains effective as your business expands.
7. Pricing and Value
Compare the pricing of different software options and consider the value they offer. Some software is free, while others are subscription-based. Determine your budget and choose the software that provides the best value for your needs. Consider the features, integrations, and support offered. Evaluate the cost-benefit ratio to make an informed decision.
Examples of Successful CRM Marketing Dashboards
Here are a few examples of how businesses are leveraging CRM marketing dashboards to achieve success:
1. E-commerce Business
An e-commerce company uses a dashboard to track website traffic, conversion rates, and sales revenue. They identify that a particular product page has a high bounce rate. They optimize the page by adding more compelling content and improving the user experience, which leads to an increase in conversions and sales.
2. SaaS Company
A SaaS company uses a dashboard to track lead generation, customer acquisition cost (CAC), and customer lifetime value (CLTV). They discover that their paid advertising campaigns have a high CAC. They adjust their targeting and messaging to improve the campaign performance, which leads to a decrease in CAC and an increase in CLTV.
3. Healthcare Provider
A healthcare provider uses a dashboard to track patient engagement, appointment scheduling, and patient satisfaction. They identify that patients are frequently missing appointments. They implement a reminder system and improve communication, which leads to a decrease in missed appointments and an increase in patient satisfaction.
These examples highlight the versatility and power of CRM marketing dashboards. By tracking the right metrics and making data-driven decisions, businesses of all types can achieve significant improvements in their marketing performance and overall business results.
Conclusion: Unleashing the Power of Data with CRM Marketing Dashboards
The CRM marketing dashboard is no longer a nice-to-have; it’s a must-have for any business serious about data-driven marketing. By providing a centralized view of your marketing performance, enabling data-driven decision-making, and empowering you to optimize your campaigns, a well-designed dashboard can be the key to unlocking significant business growth.
By following the best practices outlined in this guide, you can build a dashboard that provides valuable insights, improves your marketing performance, and drives tangible results. Embrace the power of data and take your marketing efforts to the next level. The future of marketing is data-driven, and the CRM marketing dashboard is your compass, guiding you toward success.
So, take the plunge, build your dashboard, and start seeing the difference a data-driven approach can make. The insights are waiting, and the potential for growth is immense. The time to act is now. Embrace the power, embrace the data, and embrace the future of marketing.

