CRM Marketing Infographic Design: A Visual Guide to Boosting Customer Relationships
CRM Marketing Infographic Design: A Visual Guide to Boosting Customer Relationships
In the dynamic world of marketing, staying ahead of the curve requires not just innovative strategies, but also the ability to communicate complex information in a clear, concise, and engaging manner. Enter the CRM marketing infographic – a powerful tool that combines the data-driven insights of Customer Relationship Management (CRM) with the visual appeal of graphic design. This comprehensive guide delves deep into the art and science of CRM marketing infographic design, equipping you with the knowledge and inspiration to create visuals that resonate with your audience and drive tangible results.
Understanding the Power of CRM and Infographics
Before we dive into the design aspects, let’s establish a solid understanding of the two key components: CRM and infographics.
What is CRM?
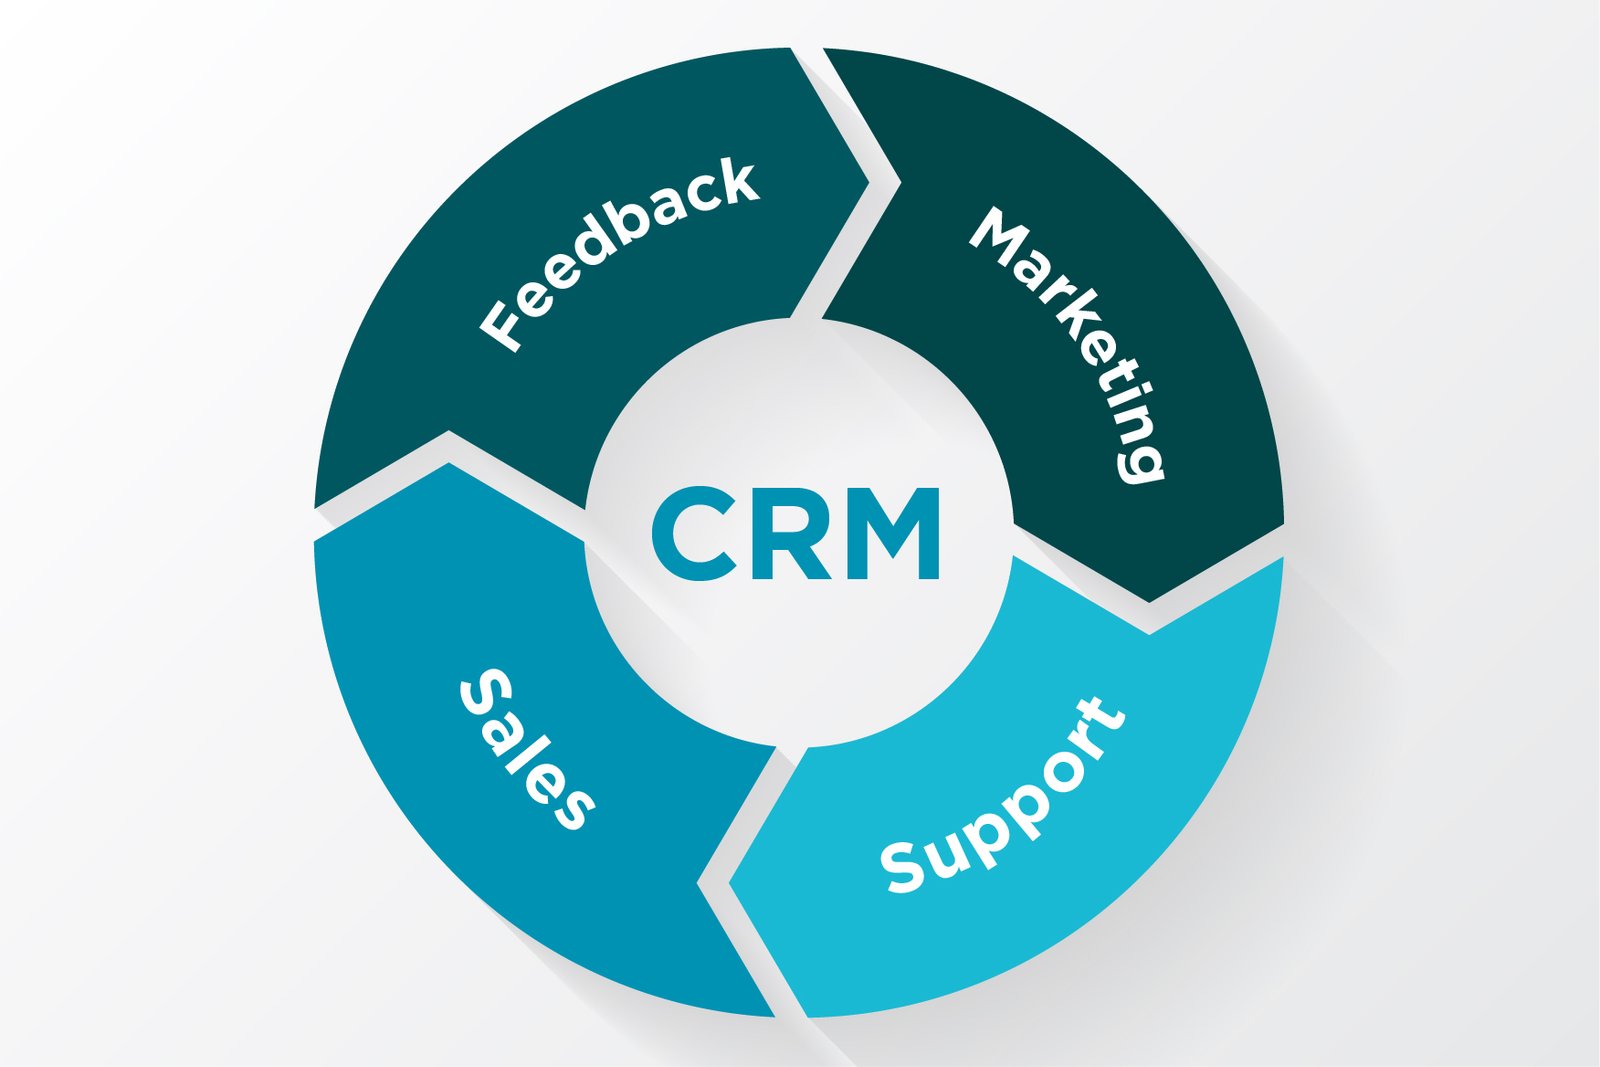
Customer Relationship Management (CRM) is more than just a software; it’s a strategic approach to managing and analyzing customer interactions and data throughout the customer lifecycle. CRM systems help businesses build stronger relationships with their customers, improve customer retention, and ultimately, drive revenue growth. CRM encompasses various aspects, including:
- Customer Data Management: Collecting, organizing, and analyzing customer data, such as contact information, purchase history, and interactions.
- Sales Automation: Streamlining sales processes, managing leads, and tracking sales performance.
- Marketing Automation: Automating marketing campaigns, personalizing customer experiences, and measuring campaign effectiveness.
- Customer Service: Providing efficient and personalized customer support through various channels.
- Reporting and Analytics: Generating reports and analyzing key performance indicators (KPIs) to gain insights into customer behavior and business performance.
The Magic of Infographics
Infographics are visual representations of data, information, or knowledge, designed to communicate complex information quickly and clearly. They leverage the power of visual elements, such as charts, graphs, icons, and illustrations, to make data more engaging and easier to understand. Infographics offer several benefits:
- Increased Engagement: Visual content is more likely to capture attention and hold the viewer’s interest compared to text-heavy content.
- Improved Comprehension: Infographics simplify complex data, making it easier for audiences to grasp key concepts and insights.
- Enhanced Memorability: Visuals are more memorable than text, increasing the likelihood that viewers will retain the information.
- Increased Shareability: Infographics are highly shareable on social media and other platforms, expanding your reach and brand visibility.
Why CRM Marketing Infographics are a Match Made in Heaven
Combining the strategic insights of CRM with the visual power of infographics creates a potent marketing tool. CRM marketing infographics can effectively communicate complex CRM data, strategies, and results in a visually appealing and easily digestible format. Here’s why they are so effective:
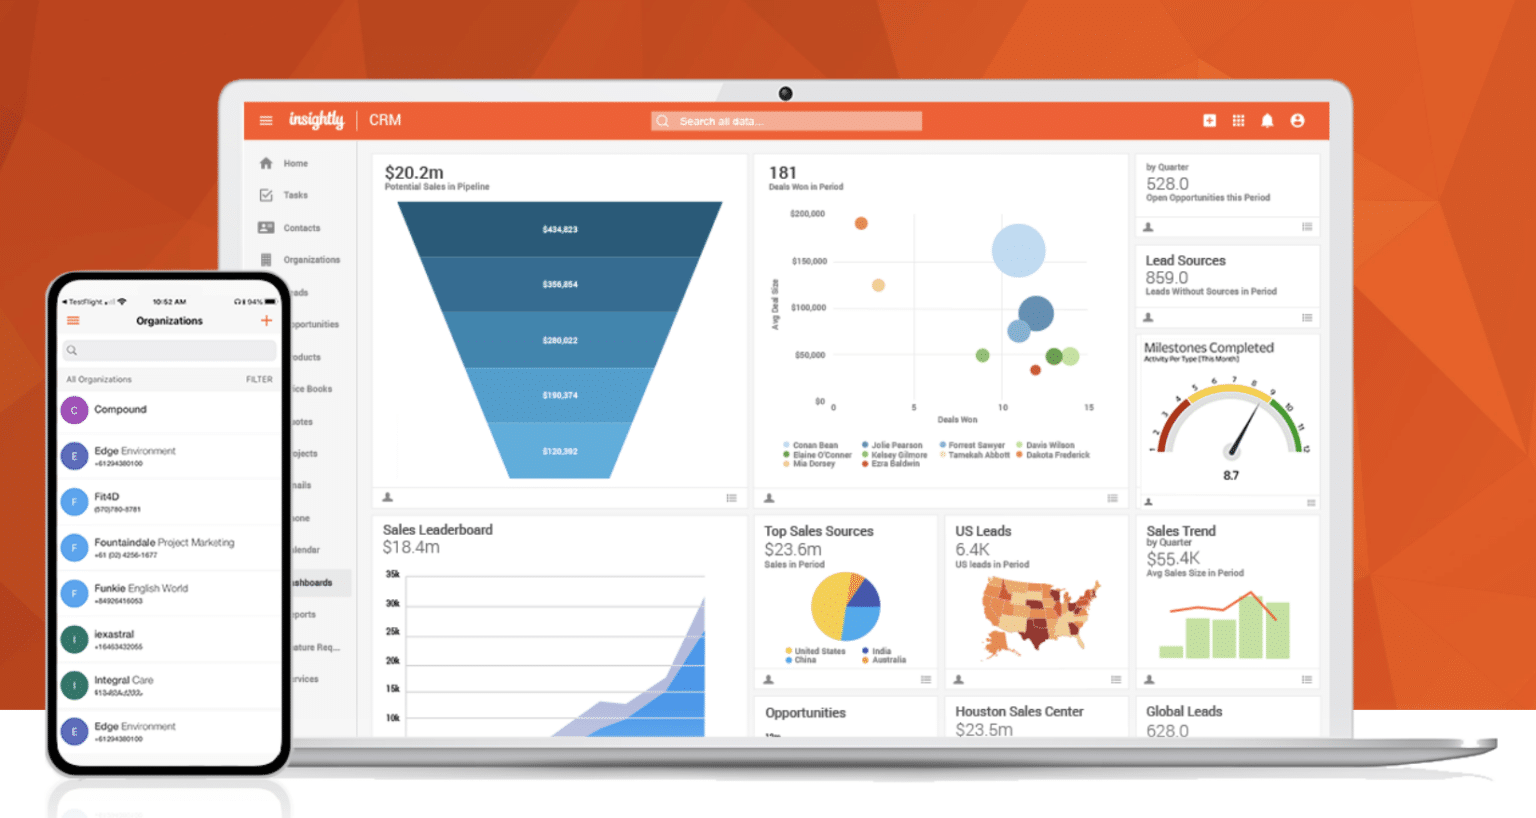
- Data Visualization: CRM systems generate vast amounts of data. Infographics transform this data into compelling visuals, such as charts, graphs, and maps, making it easier to understand trends, patterns, and insights.
- Storytelling: Infographics can tell a compelling story about your customers, your marketing efforts, and the impact of your CRM strategy. By weaving data into a narrative, you can create a more engaging and memorable experience for your audience.
- Improved Communication: Infographics bridge the communication gap between data analysts, marketers, and other stakeholders. They provide a common language for understanding CRM data and strategies.
- Increased Awareness: Sharing CRM marketing infographics on social media, your website, and other platforms can increase awareness of your brand, your CRM strategy, and your successes.
- Lead Generation: Infographics can be used as lead magnets, encouraging visitors to provide their contact information in exchange for access to valuable insights.
Key Elements of Effective CRM Marketing Infographic Design
Creating a successful CRM marketing infographic requires careful planning and execution. Here are the key elements to consider:
1. Define Your Objective and Target Audience
Before you start designing, clearly define your objective. What do you want to achieve with your infographic? Are you trying to educate your audience about CRM? Showcase the benefits of your CRM software? Or highlight the results of your marketing campaigns? Your objective will guide your content and design choices.
Also, identify your target audience. Who are you trying to reach with your infographic? Understanding their interests, needs, and preferences will help you tailor your content and design to resonate with them. Consider their level of CRM knowledge, their preferred visual styles, and the platforms where they spend their time.
2. Choose a Compelling Topic and Data
Select a topic that is relevant to your target audience and aligned with your objective. Consider the following:
- Customer Behavior: Analyze customer data to identify trends, patterns, and insights into customer behavior.
- Marketing Campaign Performance: Showcase the results of your marketing campaigns, such as lead generation, conversion rates, and ROI.
- CRM Software Features: Highlight the key features and benefits of your CRM software.
- Industry Trends: Provide insights into the latest CRM trends and best practices.
- Customer Success Stories: Share success stories of how your CRM strategy has helped your customers achieve their goals.
Gather accurate and reliable data to support your topic. Use data from your CRM system, marketing analytics platforms, and other sources. Ensure your data is relevant, up-to-date, and presented in a clear and concise manner.
3. Plan Your Layout and Structure
The layout and structure of your infographic are crucial for guiding your audience through the information. Here are some tips:
- Choose a Visual Style: Select a visual style that aligns with your brand and target audience. Consider using a consistent color palette, typography, and imagery.
- Create a Clear Hierarchy: Use headings, subheadings, and visual cues to create a clear hierarchy of information. This helps viewers understand the most important points first.
- Use a Logical Flow: Organize the information in a logical flow, such as chronological order, cause and effect, or problem-solution.
- Keep it Concise: Avoid overwhelming your audience with too much information. Focus on the most important points and use concise language.
- Use White Space: Utilize white space to create visual breathing room and prevent the infographic from looking cluttered.
4. Select Appropriate Visualizations
Choose the right type of visualizations to represent your data. Consider the following:
- Charts and Graphs: Use charts and graphs to visualize numerical data, such as sales figures, customer demographics, and marketing campaign results. Common chart types include bar charts, pie charts, line graphs, and area charts.
- Icons and Illustrations: Use icons and illustrations to represent concepts, ideas, and data points. Choose icons that are clear, simple, and visually appealing.
- Maps: Use maps to visualize geographic data, such as customer locations, sales territories, and marketing campaign reach.
- Infographics Design Elements: Use design elements such as timelines, comparisons, and processes to present information in a visually engaging and easy-to-understand manner.
5. Craft Compelling Copy
The copy in your infographic should be clear, concise, and engaging. Here are some tips:
- Use Headings and Subheadings: Use headings and subheadings to break up the text and guide the reader’s eye.
- Write Short, Concise Sentences: Avoid long, complex sentences that can be difficult to understand.
- Use Action Verbs: Use action verbs to make your copy more dynamic and engaging.
- Use Keywords: Incorporate relevant keywords to improve your infographic’s SEO.
- Include a Call to Action: Encourage your audience to take action, such as visiting your website, downloading a resource, or contacting you for more information.
6. Brand Your Infographic
Branding your infographic helps to increase brand awareness and recognition. Here are some tips:
- Include Your Logo: Place your logo prominently in the infographic.
- Use Your Brand Colors and Fonts: Use your brand colors and fonts to maintain brand consistency.
- Include Your Website URL and Social Media Handles: Make it easy for viewers to find your website and connect with you on social media.
7. Design Tools and Resources
Several design tools and resources can help you create professional-looking CRM marketing infographics. Here are some popular options:
- Canva: A user-friendly, drag-and-drop design tool with a wide range of templates, graphics, and fonts.
- Piktochart: Another popular infographic design tool with a variety of templates and customization options.
- Visme: A versatile design platform for creating infographics, presentations, and other visual content.
- Adobe Illustrator: A professional vector graphics editor for creating custom illustrations and designs.
- Adobe Photoshop: A powerful image editing software for enhancing and manipulating images.
Best Practices for CRM Marketing Infographic Design
To maximize the impact of your CRM marketing infographics, follow these best practices:
- Keep it Simple: Avoid clutter and focus on conveying the most important information in a clear and concise manner.
- Use High-Quality Visuals: Use high-quality images, illustrations, and icons to enhance the visual appeal of your infographic.
- Ensure Readability: Choose fonts that are easy to read and use a sufficient font size.
- Optimize for Mobile: Ensure your infographic is responsive and displays well on mobile devices.
- Promote Your Infographic: Share your infographic on social media, your website, and other platforms to reach a wider audience.
- Track Your Results: Monitor the performance of your infographic, such as views, shares, and engagement, to measure its effectiveness.
- Update Regularly: Keep your infographics up-to-date with the latest data and information.
- Consider Accessibility: Make your infographics accessible to people with disabilities by providing alternative text for images and using clear, concise language.
Examples of Effective CRM Marketing Infographics
Let’s explore some examples of effective CRM marketing infographics to inspire your own designs.
Infographic 1: “The Benefits of CRM for Small Businesses”
This infographic could highlight the specific advantages of CRM for small businesses. It might start with a brief overview of the challenges small businesses face, such as customer acquisition and retention. Then, it could break down the benefits of CRM, such as:
- Improved Customer Relationships: Illustrate how CRM helps small businesses understand their customers better, personalize interactions, and build stronger relationships.
- Increased Sales: Show how CRM can streamline sales processes, manage leads, and close more deals.
- Enhanced Customer Service: Demonstrate how CRM enables small businesses to provide efficient and personalized customer support.
- Cost Savings: Highlight how CRM can reduce costs by automating tasks and improving efficiency.
- Increased Productivity: Illustrate how CRM can help small businesses become more productive by automating tasks and streamlining workflows.
The infographic could use a clean and simple design with icons representing each benefit. Charts could show the percentage increase in sales or customer satisfaction after implementing CRM. The call to action could be to download a free CRM guide or schedule a demo.
Infographic 2: “How to Choose the Right CRM Software”
This infographic could guide viewers through the process of selecting the right CRM software for their needs. It could include the following steps:
- Define Your Needs: Start with a section on identifying your business goals and CRM requirements. This could involve questions like: What are your biggest customer relationship challenges? What features do you need?
- Research CRM Providers: Provide a comparison of different CRM software options, highlighting their features, pricing, and target audience. This section could include brief descriptions of popular CRM platforms like Salesforce, HubSpot, Zoho CRM, and others.
- Evaluate the Features: Showcase the key features to look for in a CRM, such as contact management, sales automation, marketing automation, and reporting.
- Consider Pricing and Support: Explain the different pricing models and the importance of customer support.
- Read Reviews and Get Recommendations: Encourage viewers to read online reviews and seek recommendations from other businesses.
- Take a Free Trial: Suggest that viewers try out a free trial of the CRM software before making a decision.
The design could be a step-by-step process, with each step represented by an icon. Charts could show the market share of different CRM providers. The call to action could be to visit a website with CRM software reviews or download a CRM comparison checklist.
Infographic 3: “The Customer Journey in the Age of CRM”
This infographic could illustrate the customer journey from the perspective of a CRM system. It could:
- Start with Awareness: Show how CRM helps marketers track and manage leads generated through marketing campaigns.
- Move to Consideration: Illustrate how CRM personalizes interactions and provides relevant information to nurture leads.
- Follow with Decision: Show how CRM assists in closing deals and converting leads into customers.
- Highlight Retention: Demonstrate how CRM helps businesses retain customers by providing excellent customer service and personalized experiences.
- Focus on Advocacy: Show how CRM helps build customer loyalty and encourages customers to become brand advocates.
The design could be a visual representation of the customer journey, with each stage represented by a different section. Icons and illustrations could represent customer interactions and touchpoints. The call to action could be to schedule a CRM consultation.
Measuring the Impact of Your CRM Marketing Infographic
Once your infographic is published, it’s important to measure its impact. Here are some key metrics to track:
- Views: Track the number of views your infographic receives on your website, social media, and other platforms.
- Shares: Monitor the number of times your infographic is shared on social media and other platforms.
- Engagement: Measure the level of engagement with your infographic, such as likes, comments, and shares.
- Website Traffic: Track the increase in website traffic that results from your infographic.
- Lead Generation: Measure the number of leads generated through your infographic.
- Conversion Rates: Track the conversion rates of leads generated through your infographic.
Use analytics tools, such as Google Analytics, to track these metrics. Analyze the data to understand what’s working and what’s not. Use this information to optimize your future infographics and improve your CRM marketing strategy.
Conclusion: The Future of CRM Marketing Infographic Design
CRM marketing infographic design is a powerful tool for communicating complex information, engaging your audience, and driving results. By understanding the key elements of effective design and following best practices, you can create infographics that resonate with your audience and help you achieve your marketing goals. As technology and marketing trends evolve, the importance of visual communication will only continue to grow. Embrace the power of CRM marketing infographic design to stay ahead of the curve and build stronger customer relationships.
By consistently creating high-quality, informative, and visually appealing infographics, you can establish your brand as a thought leader in the CRM space, attract new customers, and drive revenue growth. Remember to always prioritize clarity, accuracy, and relevance in your content. And don’t be afraid to experiment with different design styles, data visualizations, and storytelling techniques to find what works best for your audience.
The future of CRM marketing infographic design is bright. As businesses become more data-driven and customer-centric, the demand for effective visual communication will only increase. By mastering the art and science of CRM marketing infographic design, you can position yourself for success in the ever-evolving world of marketing.


