CRM Marketing Infographic Design: A Visual Guide to Boost Customer Engagement and Sales
In today’s fast-paced digital landscape, businesses are constantly seeking innovative ways to connect with their customers, streamline operations, and ultimately, drive sales. One powerful tool that has emerged as a game-changer is Customer Relationship Management (CRM) marketing. But understanding the nuances of CRM, and how to effectively leverage it, can sometimes feel overwhelming. That’s where the magic of CRM marketing infographic design comes in. This guide will delve into the world of CRM marketing infographics, exploring their benefits, design principles, and how you can create compelling visuals that resonate with your audience and elevate your marketing efforts.
What is CRM Marketing? A Quick Overview
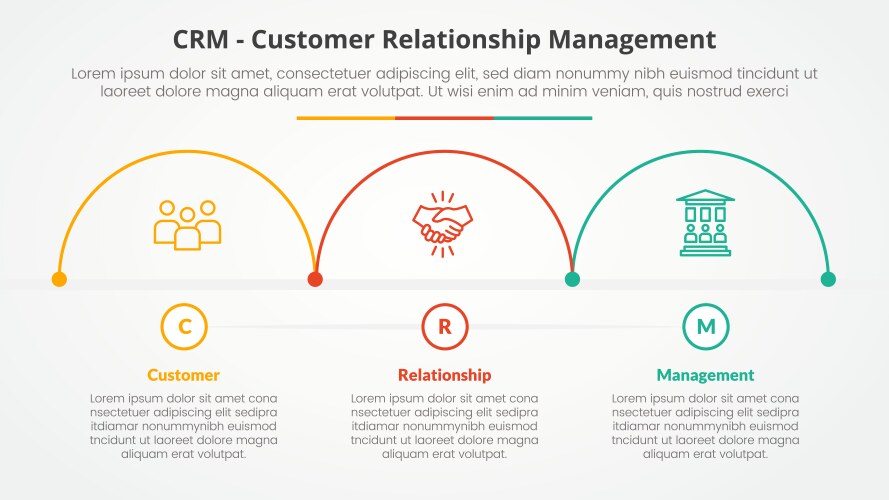
Before we dive into the visual aspects, let’s clarify the core concept. CRM marketing is a strategic approach that uses CRM systems to manage and analyze customer interactions and data throughout the customer lifecycle. The primary goal? To improve business relationships, assist in customer retention, and drive sales growth. It’s about understanding your customers’ needs, preferences, and behaviors to deliver personalized experiences that keep them coming back for more.
Think of it as building a strong foundation for your business, one customer at a time. It’s not just about collecting data; it’s about using that data to create meaningful connections and tailor your marketing messages to each individual. This leads to increased customer satisfaction, loyalty, and, of course, a healthier bottom line.
Key Components of CRM Marketing
- Customer Data Management: Collecting, organizing, and analyzing customer data from various sources.
- Segmentation: Grouping customers based on shared characteristics, such as demographics, purchase history, and behavior.
- Personalization: Tailoring marketing messages and offers to individual customer preferences.
- Automation: Streamlining marketing processes using automated workflows.
- Analytics and Reporting: Tracking key performance indicators (KPIs) and measuring the success of marketing campaigns.
The Power of Infographics in CRM Marketing
Now, let’s talk about why infographics are such a valuable asset in the world of CRM marketing. In a world saturated with information, grabbing your audience’s attention can be a challenge. Infographics are the superheroes of content marketing, transforming complex data and concepts into visually appealing and easily digestible formats. They leverage the power of visual communication to tell a story, making information more memorable and shareable. Here’s why infographics are a must-have for your CRM marketing strategy:
Benefits of Using CRM Marketing Infographics
- Enhanced Understanding: Complex CRM concepts become easier to grasp through visual representations.
- Increased Engagement: Eye-catching designs and compelling visuals capture attention and encourage interaction.
- Improved Shareability: Infographics are highly shareable on social media, boosting brand awareness.
- Data Visualization: Infographics effectively present data, statistics, and trends in an accessible format.
- Brand Storytelling: Infographics allow you to tell your brand story and communicate your value proposition in a visually engaging way.
- Lead Generation: Infographics can be used as lead magnets, encouraging users to provide their contact information in exchange for valuable content.
Key Elements of Effective CRM Marketing Infographic Design
Creating a successful CRM marketing infographic requires careful planning and execution. It’s not just about throwing data and visuals together; it’s about crafting a cohesive and engaging narrative. Here are some essential design elements to consider:
1. Defining Your Goals and Target Audience
Before you even start sketching ideas, it’s crucial to define your objectives. What do you want your infographic to achieve? Are you aiming to educate your audience about CRM benefits, showcase the features of your CRM software, or highlight customer success stories? Knowing your goals will guide your content and design choices. Equally important is understanding your target audience. Who are you trying to reach? What are their interests, needs, and pain points? Tailoring your infographic to your audience ensures it resonates with them and achieves its intended purpose.
2. Choosing the Right Data and Content
Once you have your goals and audience defined, it’s time to gather the relevant data and content. The information you include should be accurate, concise, and relevant to your topic. Focus on presenting key insights and takeaways that your audience will find valuable. Use statistics, facts, and figures to support your claims and create a strong narrative. Remember, less is often more. Avoid overwhelming your audience with too much information. Prioritize the most important points and present them in a clear and easy-to-understand format.
3. Crafting a Compelling Story
An effective infographic tells a story. It should have a clear beginning, middle, and end, guiding the viewer through the information in a logical and engaging manner. Start with an attention-grabbing introduction that hooks your audience and sets the stage for the rest of the infographic. Develop a narrative that flows smoothly, using visuals and text to illustrate your points. End with a strong call to action, encouraging your audience to take the next step, such as visiting your website, downloading a resource, or contacting your sales team.
4. Visual Design and Layout
Visual design is the heart of any infographic. It’s what captures your audience’s attention and keeps them engaged. Here are some key design principles to consider:
- Color Palette: Choose a color palette that aligns with your brand identity and is visually appealing. Use colors strategically to highlight key information and create contrast.
- Typography: Select fonts that are easy to read and complement your design. Use different font sizes and styles to create hierarchy and guide the viewer’s eye.
- Visual Hierarchy: Arrange elements in a way that guides the viewer through the information in a logical order. Use size, color, and spacing to emphasize important points.
- Icons and Illustrations: Use icons and illustrations to represent data, concepts, and ideas. Choose visuals that are clear, consistent, and relevant to your topic.
- Whitespace: Don’t be afraid to use whitespace (empty space) to create visual breathing room and prevent your infographic from feeling cluttered.
- Layout: Choose a layout that is appropriate for your content and audience. Common layout options include timelines, lists, comparisons, and process diagrams.
5. Ensuring Readability and Accessibility
Your infographic should be easy to read and understand. Use clear and concise language, avoiding jargon or technical terms that your audience may not be familiar with. Ensure that your text is large enough to read comfortably, and that there is sufficient contrast between the text and the background. Consider accessibility for users with disabilities. Use alt text for images, provide captions for visual elements, and ensure that your infographic is compatible with screen readers.
6. Branding and Consistency
Your infographic should reflect your brand identity. Use your brand colors, fonts, and logo to create a cohesive and recognizable design. Maintain consistency throughout the infographic, using the same design elements and style for all visuals and text. This will help reinforce your brand and create a professional look and feel.
Tools and Resources for Creating CRM Marketing Infographics
You don’t need to be a professional designer to create effective infographics. Numerous tools and resources are available to help you bring your ideas to life. Here are some popular options:
- Canva: A user-friendly design platform with a vast library of templates, graphics, and fonts. Ideal for beginners.
- Piktochart: Another popular design tool with a wide range of templates and customization options.
- Visme: A versatile platform for creating infographics, presentations, and other visual content.
- Adobe Illustrator: A professional design software for creating high-quality graphics and illustrations. Requires a steeper learning curve.
- Adobe Photoshop: A powerful image editing software that can be used to enhance and create visual elements for your infographics.
- Infographic Templates: Websites like Venngage and Creative Market offer pre-designed infographic templates that you can customize to fit your needs.
- Stock Photos and Icons: Websites like Unsplash, Pexels, and Flaticon provide free or low-cost stock photos and icons that you can use in your designs.
Examples of Effective CRM Marketing Infographics
Let’s take a look at some examples of successful CRM marketing infographics to inspire your own creations:
- CRM Benefits Infographic: This type of infographic typically highlights the advantages of using a CRM system, such as improved customer relationships, increased sales, and enhanced efficiency. It often includes statistics, charts, and graphs to illustrate the positive impact of CRM.
- CRM Software Comparison Infographic: If you’re looking to help your audience choose the right CRM software, a comparison infographic is a great option. It compares different CRM platforms based on features, pricing, and ease of use.
- CRM Implementation Guide Infographic: This infographic provides a step-by-step guide to implementing a CRM system, covering topics such as data migration, user training, and system customization.
- Customer Journey Infographic: Visualize the customer journey from awareness to purchase. It helps businesses understand customer behavior and identify opportunities to improve the customer experience.
- CRM Marketing Stats Infographic: Showcase key statistics and trends related to CRM marketing. This can include data on customer satisfaction, sales growth, and ROI.
Tips for Promoting Your CRM Marketing Infographics
Creating a great infographic is only half the battle. You also need to promote it to reach your target audience. Here are some effective promotion strategies:
- Share on Social Media: Share your infographic on all your social media channels, including Facebook, Twitter, LinkedIn, and Instagram. Use relevant hashtags to increase visibility.
- Embed on Your Website: Embed your infographic on your website or blog. This will make it accessible to your website visitors and improve your SEO.
- Email Marketing: Send an email to your subscribers, promoting your infographic and encouraging them to share it with their networks.
- Guest Blogging: Write guest blog posts on relevant websites and include your infographic in the content.
- Infographic Directories: Submit your infographic to infographic directories to reach a wider audience.
- Paid Advertising: Consider using paid advertising on social media or search engines to promote your infographic and reach a larger audience.
- Influencer Marketing: Partner with influencers in your industry to promote your infographic to their followers.
Measuring the Success of Your CRM Marketing Infographics
To ensure that your infographics are effective, it’s important to track their performance. Here are some key metrics to monitor:
- Website Traffic: Track the number of visitors to your website or blog.
- Social Media Shares: Monitor the number of times your infographic is shared on social media.
- Backlinks: Check for backlinks to your infographic, as this indicates that other websites are referencing your content.
- Lead Generation: Measure the number of leads generated through your infographic, such as email sign-ups or downloads.
- Conversion Rates: Track the conversion rates from your infographic, such as the percentage of visitors who become customers.
- Engagement: Monitor engagement metrics, such as likes, comments, and shares on social media.
Conclusion: Unleash the Power of Visuals in CRM Marketing
CRM marketing infographics are a powerful tool for communicating complex information, engaging your audience, and driving results. By following the design principles and best practices outlined in this guide, you can create visually appealing and effective infographics that will elevate your CRM marketing efforts. Remember to define your goals, understand your audience, and craft a compelling story. With the right approach, your CRM marketing infographics can become a valuable asset in your overall marketing strategy, helping you build stronger customer relationships and achieve your business objectives. Go forth, design, and watch your CRM marketing soar!
By embracing the power of visual communication, you can transform your CRM marketing strategy and create a lasting impact on your business. The key is to be creative, informative, and always focused on providing value to your audience. Happy designing!


