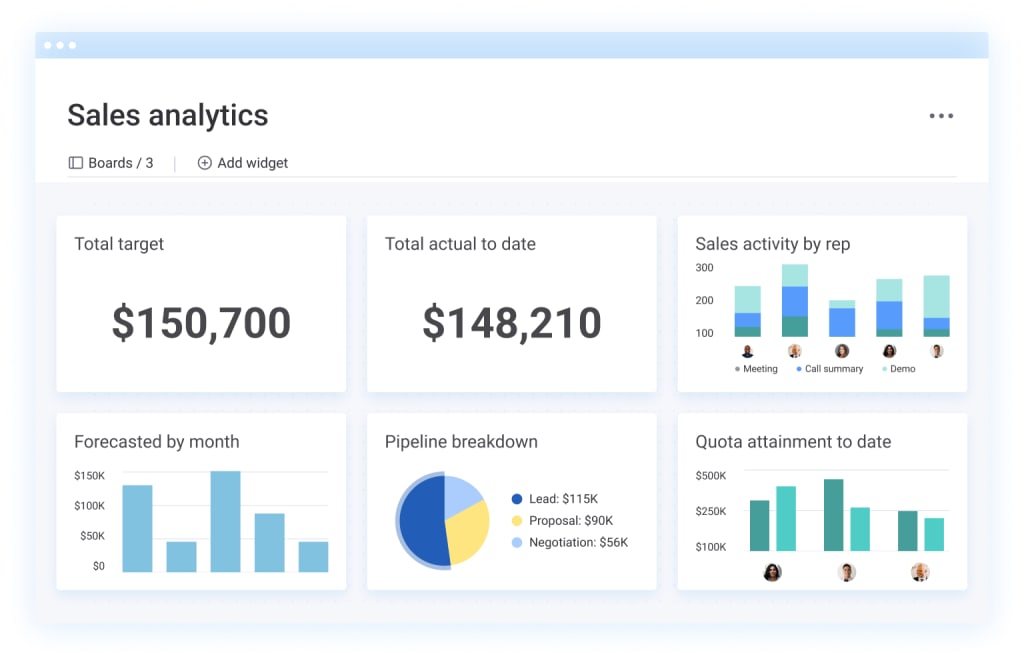
Introduction: The Power of the CRM Marketing Dashboard
In today’s fast-paced business environment, staying ahead of the curve is crucial. And at the heart of any successful marketing strategy lies the ability to understand your customers, track your progress, and make data-driven decisions. That’s where the CRM marketing dashboard comes in. Think of it as your central command center, providing a real-time snapshot of your marketing efforts and their impact. It’s not just about collecting data; it’s about turning that data into actionable insights that drive growth.
This comprehensive guide will walk you through everything you need to know about setting up a CRM marketing dashboard. From understanding the core components to choosing the right CRM platform and customizing your dashboard for optimal performance, we’ll cover it all. We’ll delve into the essential metrics you should track, provide practical tips for data visualization, and explore advanced features that can take your marketing strategies to the next level. Get ready to transform your marketing approach and achieve remarkable results.
Understanding the Fundamentals of CRM Marketing Dashboards
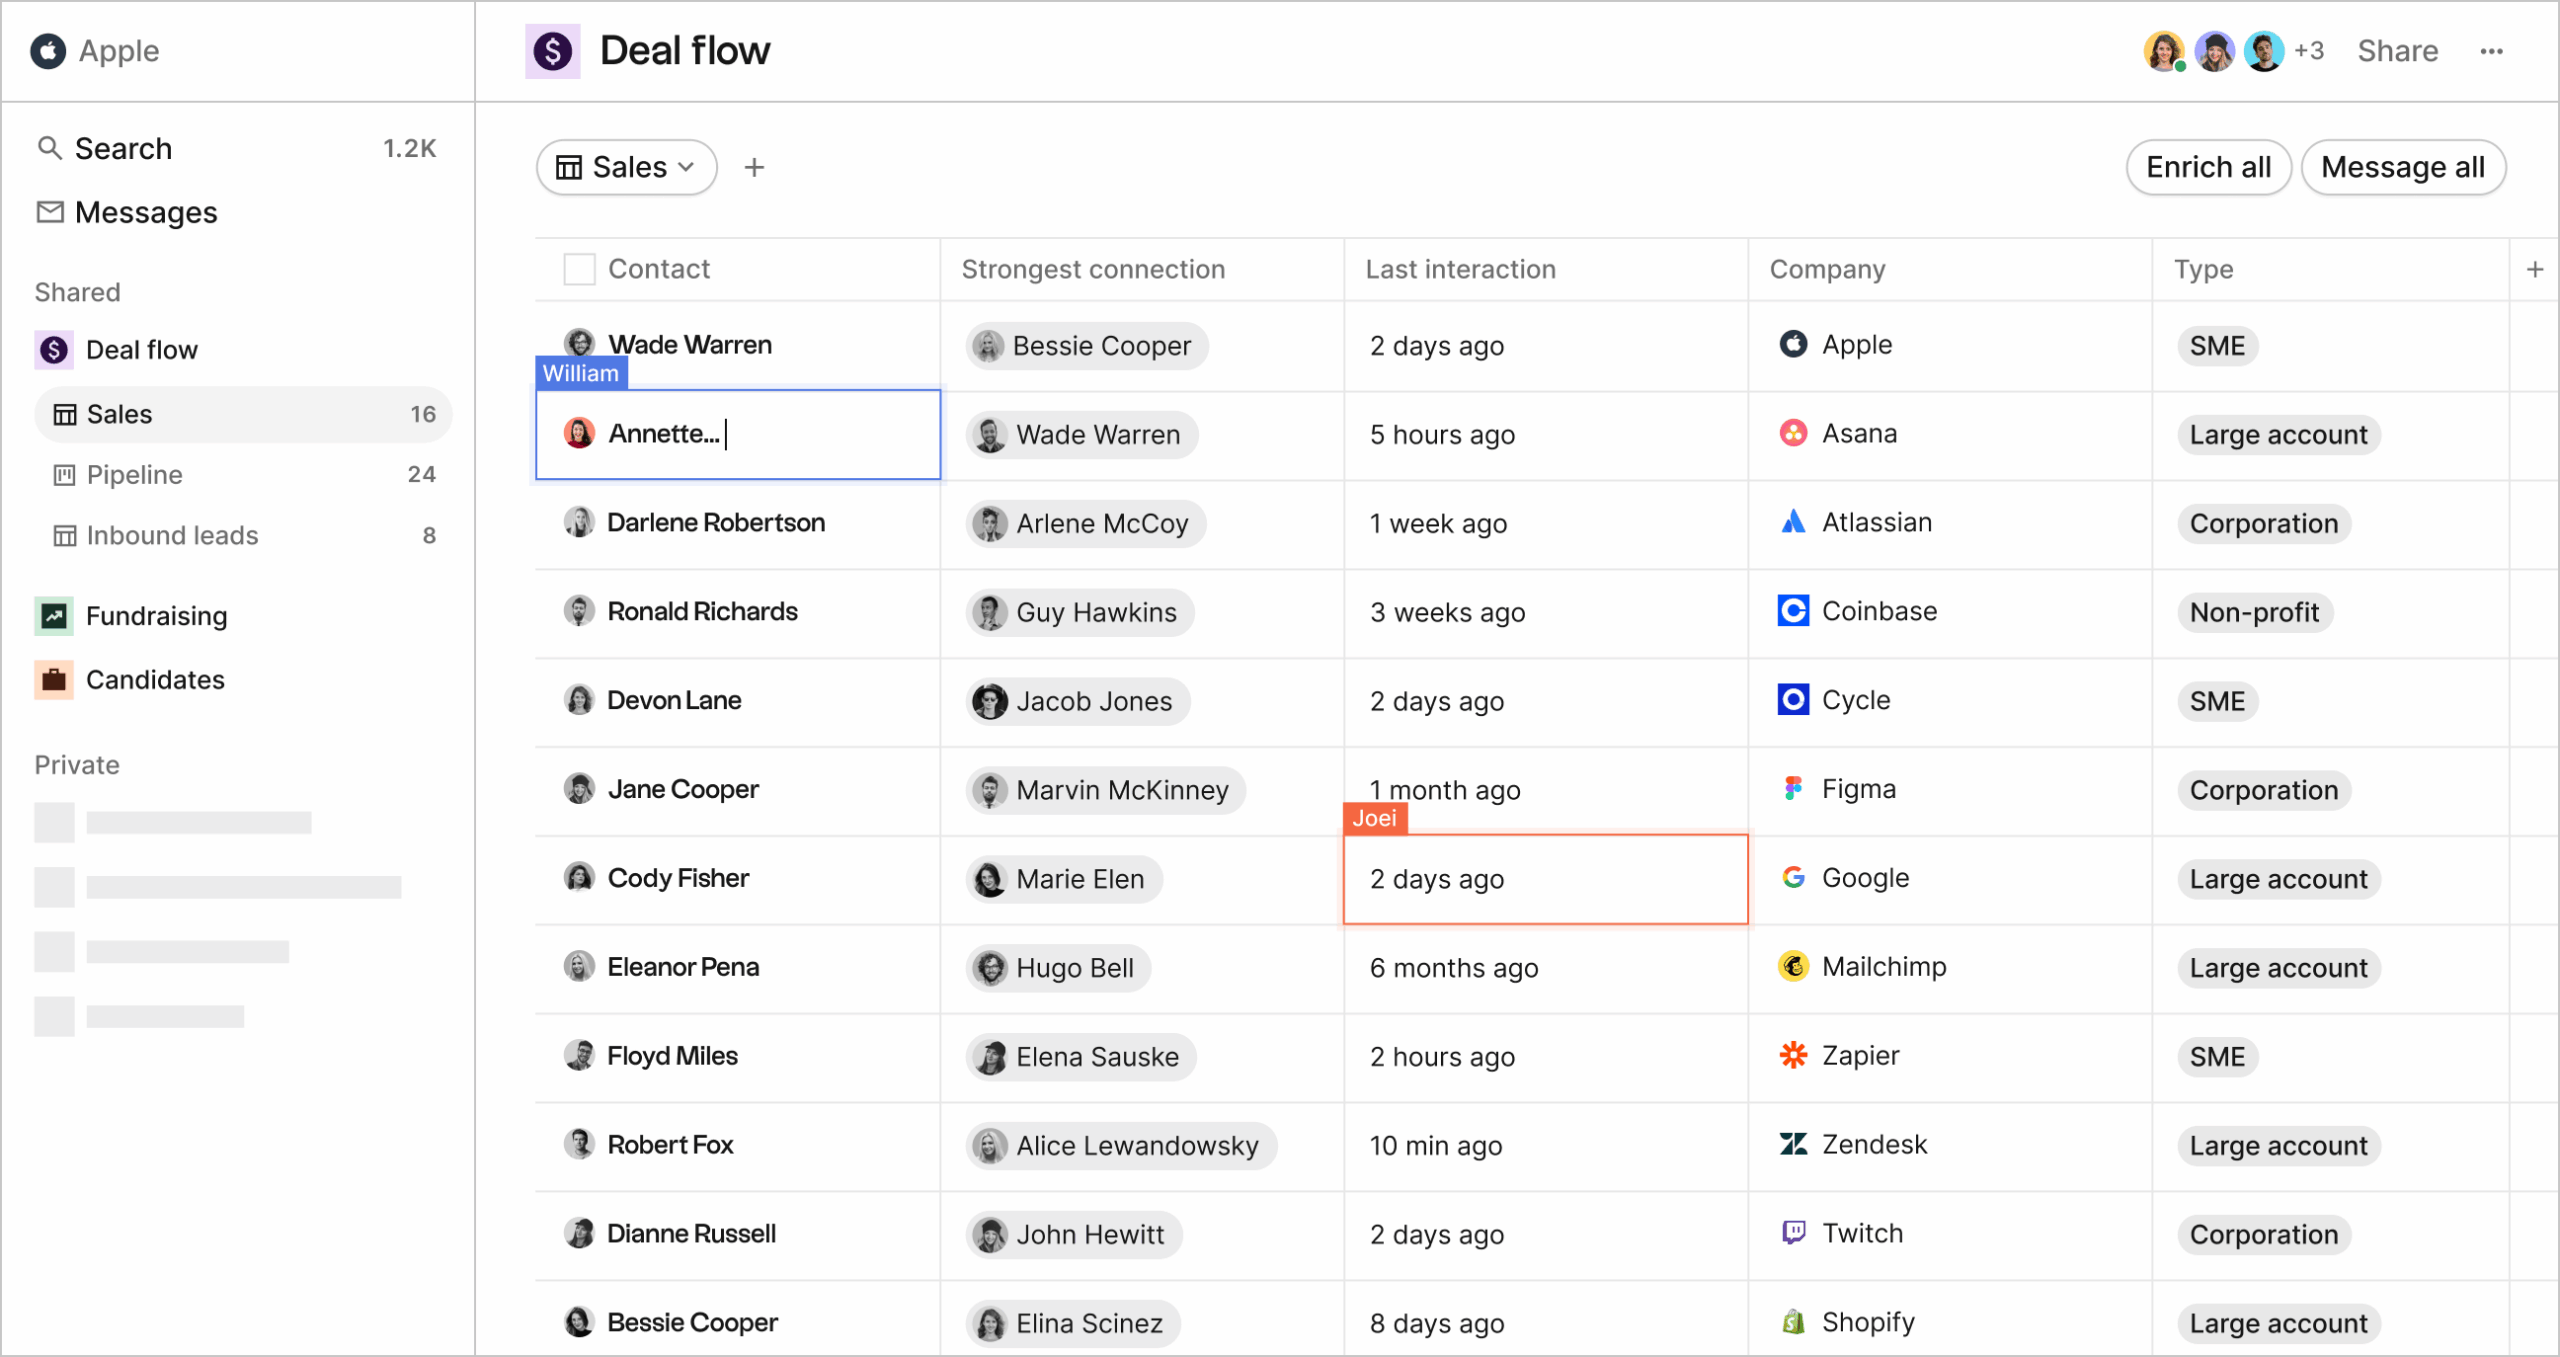
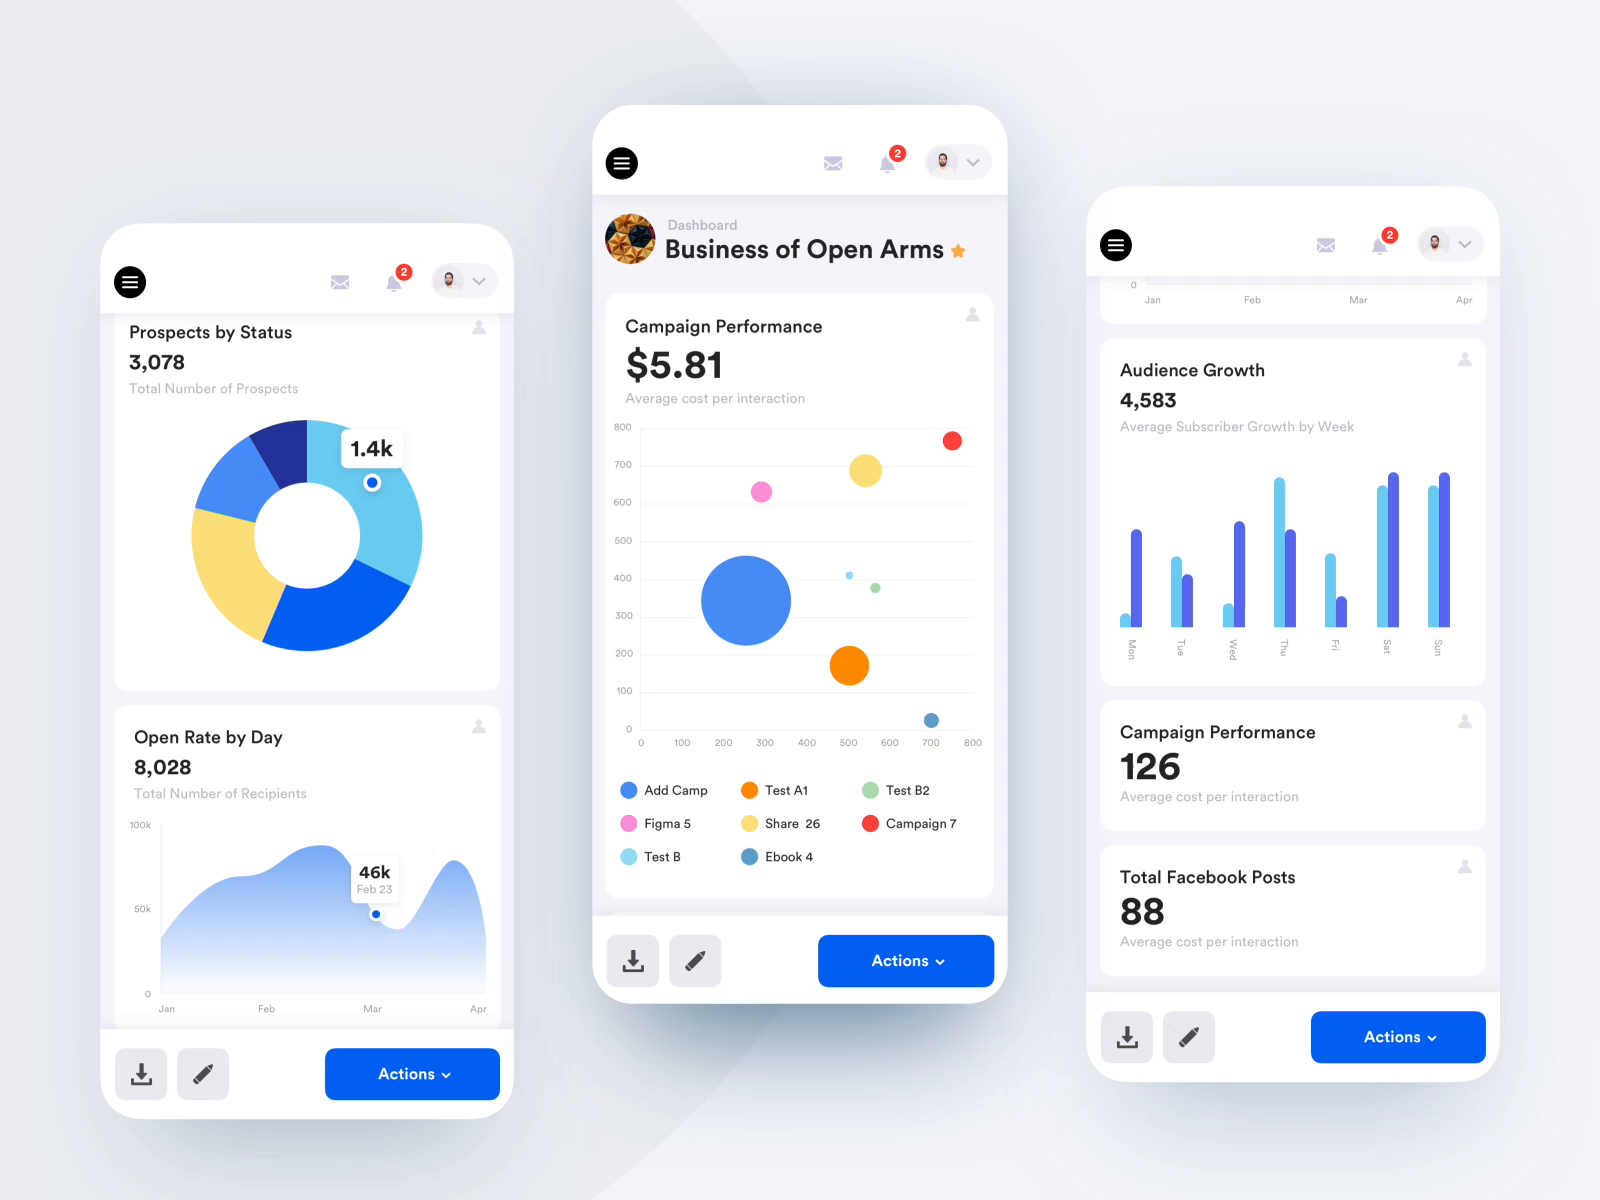
Before diving into the setup process, it’s essential to grasp the fundamental concepts of CRM marketing dashboards. At its core, a CRM marketing dashboard is a visual representation of your marketing data, providing a clear and concise overview of your key performance indicators (KPIs). It’s designed to help you monitor your progress, identify areas for improvement, and make informed decisions that align with your business objectives.
Here are some of the key components of a CRM marketing dashboard:
- Data Sources: This includes all the sources from which your data is pulled, such as your CRM platform (e.g., Salesforce, HubSpot, Zoho CRM), marketing automation tools (e.g., Marketo, Pardot), social media platforms, and website analytics tools (e.g., Google Analytics).
- Metrics and KPIs: These are the specific measurements you track to assess the performance of your marketing campaigns. Examples include website traffic, lead generation, conversion rates, customer acquisition cost (CAC), and return on investment (ROI).
- Data Visualization: This involves presenting your data in a clear and easily understandable format, such as charts, graphs, and tables. Effective data visualization allows you to quickly identify trends, patterns, and anomalies.
- Reporting and Analysis: This includes the ability to generate reports, analyze data, and gain insights that inform your marketing strategies.
The primary purpose of a CRM marketing dashboard is to provide a centralized view of your marketing performance, enabling you to:
- Monitor Key Metrics: Track your progress against your marketing goals and objectives.
- Identify Trends and Patterns: Discover insights that can inform your marketing strategies.
- Optimize Campaigns: Make data-driven decisions to improve the performance of your marketing campaigns.
- Improve ROI: Maximize your return on investment by focusing on the most effective marketing activities.
- Make Data-Driven Decisions: Base your marketing strategies on objective data rather than guesswork.
Choosing the Right CRM Platform for Your Needs
The foundation of your CRM marketing dashboard is the CRM platform itself. Choosing the right platform is a critical decision that can significantly impact your marketing efforts. Several options are available, each with its own strengths and weaknesses. Let’s explore some of the leading CRM platforms and the factors you should consider when making your selection.
Popular CRM Platforms
- Salesforce: A market leader, Salesforce offers a comprehensive suite of features and is suitable for businesses of all sizes. It’s highly customizable and integrates with a wide range of third-party applications. However, it can be complex to set up and manage.
- HubSpot: HubSpot is a popular choice for businesses focused on inbound marketing. It offers a user-friendly interface, robust marketing automation features, and excellent reporting capabilities. It’s well-suited for small to medium-sized businesses.
- Zoho CRM: Zoho CRM is a cost-effective option that provides a comprehensive set of features, including sales, marketing, and customer service modules. It’s a good choice for small to medium-sized businesses looking for an affordable CRM solution.
- Microsoft Dynamics 365: Microsoft Dynamics 365 is a powerful CRM platform that integrates seamlessly with other Microsoft products. It’s well-suited for businesses that already use Microsoft products and require advanced features.
- Pipedrive: Pipedrive is a sales-focused CRM platform that’s known for its user-friendly interface and pipeline management features. It’s a good choice for businesses that prioritize sales efficiency.
Factors to Consider When Choosing a CRM Platform
When selecting a CRM platform, consider the following factors:
- Your Business Needs: Assess your specific marketing requirements and identify the features you need. Do you need marketing automation, lead management, or social media integration?
- Scalability: Choose a platform that can grow with your business. Consider the number of users, the volume of data, and the potential for future expansion.
- Ease of Use: Select a platform with a user-friendly interface that’s easy to learn and use. Consider the training requirements and the level of technical expertise required.
- Integration Capabilities: Ensure the platform integrates with your existing marketing tools and other business applications.
- Cost: Evaluate the pricing plans and choose a platform that fits your budget. Consider the ongoing costs, such as subscription fees and implementation costs.
- Customer Support: Check the availability and quality of customer support. Make sure the vendor offers adequate support and resources to help you with any issues.
Before making a final decision, take advantage of free trials and demos offered by the different CRM vendors. This will allow you to test the platforms and determine which one best meets your needs.
Step-by-Step Guide to Setting Up Your CRM Marketing Dashboard
Now that you understand the fundamentals and have chosen your CRM platform, it’s time to set up your marketing dashboard. This step-by-step guide will walk you through the process, providing practical tips and best practices along the way.
Step 1: Define Your Marketing Goals and Objectives
Before you start building your dashboard, clearly define your marketing goals and objectives. What do you want to achieve with your marketing efforts? Are you trying to increase website traffic, generate more leads, improve conversion rates, or boost sales? Having clearly defined goals will help you determine the metrics you need to track and the data you need to collect.
Examples of marketing goals and objectives:
- Increase website traffic by 20% in the next quarter.
- Generate 100 qualified leads per month.
- Improve the conversion rate of your landing pages by 10%.
- Increase sales revenue by 15% in the next year.
Step 2: Identify Your Key Performance Indicators (KPIs)
Once you’ve defined your goals, identify the KPIs that will help you measure your progress. KPIs are the specific metrics that you will track to assess the performance of your marketing campaigns. Choose KPIs that are relevant to your goals and provide a clear picture of your marketing performance.
Examples of KPIs:
- Website Traffic: Number of visits, unique visitors, bounce rate, time on site.
- Lead Generation: Number of leads generated, lead-to-opportunity conversion rate, cost per lead.
- Conversion Rates: Landing page conversion rate, sales conversion rate, customer acquisition cost (CAC).
- Social Media Engagement: Number of followers, likes, shares, comments, engagement rate.
- Email Marketing: Open rate, click-through rate, conversion rate, unsubscribe rate.
- Sales Revenue: Total revenue, revenue per customer, average deal size.
- Return on Investment (ROI): Marketing ROI, campaign ROI.
Step 3: Select and Configure Your Data Sources
Determine the data sources you need to connect to your CRM platform. This typically includes your CRM system, marketing automation tools, website analytics tools, social media platforms, and any other relevant data sources. Configure the connections to ensure that data is pulled into your dashboard accurately and consistently.
Here’s how to set up connections with some common data sources:
- CRM: Most CRM platforms have built-in integrations with marketing tools. Follow the instructions provided by your CRM vendor to connect your marketing data.
- Google Analytics: Connect your Google Analytics account to your CRM platform to track website traffic, user behavior, and conversion data.
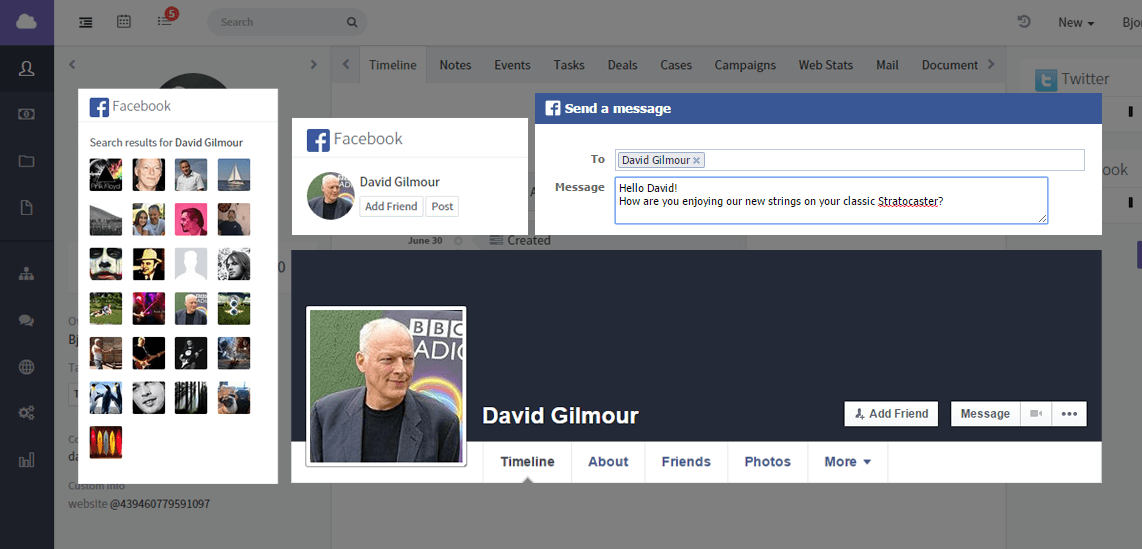
- Social Media Platforms: Integrate your social media accounts to track engagement, reach, and other relevant metrics.
- Email Marketing Tools: Connect your email marketing platform to track email open rates, click-through rates, and conversions.
Step 4: Design Your Dashboard Layout
Plan the layout of your dashboard to ensure that it’s easy to read and understand. Consider the following factors:
- Organization: Group related metrics together to make it easier to track your progress.
- Prioritization: Place the most important KPIs at the top of your dashboard for quick access.
- Visualizations: Use a variety of charts, graphs, and tables to present your data in a clear and concise format.
- Customization: Customize the dashboard to fit your specific needs and preferences.
Some common dashboard layout options:
- Overview Dashboard: Provides a high-level summary of your key metrics.
- Campaign-Specific Dashboard: Tracks the performance of individual marketing campaigns.
- Channel-Specific Dashboard: Focuses on the performance of specific marketing channels, such as social media or email marketing.
Step 5: Choose Your Data Visualization Tools
Select the appropriate data visualization tools to present your data effectively. Choose charts and graphs that best represent your data and provide insights into your marketing performance. Common data visualization tools include:
- Line Charts: Track trends over time.
- Bar Charts: Compare the performance of different categories.
- Pie Charts: Show the proportion of different categories.
- Tables: Display detailed data in a structured format.
- Gauges: Visualize progress towards a specific goal.
Step 6: Implement and Test Your Dashboard
Once you’ve designed your dashboard layout and chosen your data visualization tools, it’s time to implement your dashboard. Configure the data sources, select your KPIs, and create the visualizations. Test your dashboard thoroughly to ensure that the data is accurate and that the visualizations are displaying correctly. Make any necessary adjustments to improve the clarity and usability of your dashboard.
Step 7: Train Your Team
Once your dashboard is set up, train your team on how to use it. Explain the key metrics, how to interpret the data, and how to use the dashboard to make data-driven decisions. Provide ongoing training and support to ensure that your team is comfortable using the dashboard and can effectively leverage its insights.
Step 8: Analyze and Optimize Your Dashboard
Regularly analyze your dashboard to identify areas for improvement. Review the data, identify trends and patterns, and make adjustments to your marketing strategies based on your findings. Continuously optimize your dashboard by refining your KPIs, improving your data visualizations, and adding new features as needed.
Essential Metrics to Track in Your CRM Marketing Dashboard
To gain a comprehensive understanding of your marketing performance, it’s essential to track a range of metrics in your CRM marketing dashboard. The specific metrics you track will depend on your marketing goals and objectives, but here are some essential metrics to consider:
Website Traffic and Engagement
- Website Traffic: The total number of visits to your website.
- Unique Visitors: The number of individual visitors to your website.
- Bounce Rate: The percentage of visitors who leave your website after viewing only one page.
- Time on Site: The average amount of time visitors spend on your website.
- Pages per Session: The average number of pages visitors view per session.
Lead Generation
- Number of Leads Generated: The total number of leads generated through your marketing efforts.
- Lead-to-Opportunity Conversion Rate: The percentage of leads that convert into opportunities.
- Cost Per Lead (CPL): The cost of generating a single lead.
- Lead Source: The source of your leads (e.g., organic search, social media, paid advertising).
Conversion Rates
- Landing Page Conversion Rate: The percentage of visitors who complete a specific action on a landing page (e.g., filling out a form, downloading a resource).
- Sales Conversion Rate: The percentage of leads that convert into customers.
- Customer Acquisition Cost (CAC): The cost of acquiring a new customer.
- Marketing Qualified Leads (MQLs) to Sales Qualified Leads (SQLs) Conversion Rate: The percentage of MQLs that are qualified by sales.
Email Marketing Performance
- Open Rate: The percentage of emails that are opened by recipients.
- Click-Through Rate (CTR): The percentage of recipients who click on a link in your email.
- Conversion Rate: The percentage of recipients who complete a desired action after clicking on a link in your email.
- Unsubscribe Rate: The percentage of recipients who unsubscribe from your email list.
Social Media Engagement
- Number of Followers: The total number of followers on your social media platforms.
- Likes, Shares, and Comments: The number of likes, shares, and comments on your social media posts.
- Engagement Rate: The percentage of users who interact with your social media content.
- Reach: The number of unique users who see your social media posts.
Sales Revenue and ROI
- Total Revenue: The total revenue generated from your marketing efforts.
- Revenue per Customer: The average revenue generated per customer.
- Average Deal Size: The average value of your sales deals.
- Marketing ROI: The return on investment for your marketing campaigns.
Data Visualization Best Practices for Your CRM Marketing Dashboard
Effective data visualization is crucial for making your CRM marketing dashboard informative and actionable. Here are some best practices to help you create compelling visualizations:
Choose the Right Chart Type
Select chart types that are appropriate for the data you are presenting. Consider the following:
- Line Charts: Ideal for showing trends over time.
- Bar Charts: Effective for comparing different categories.
- Pie Charts: Useful for displaying proportions. Avoid using them when comparing many categories.
- Scatter Plots: Useful for visualizing the relationship between two variables.
- Tables: Best for presenting detailed data in a structured format.
Keep it Simple
Avoid cluttering your visualizations with unnecessary elements. Use clear and concise labels, titles, and legends. Focus on highlighting the most important information.
Use Color Wisely
Use color strategically to highlight key data points and improve readability. Use a consistent color scheme throughout your dashboard. Avoid using too many colors, which can be distracting.
Provide Context
Add context to your visualizations by including labels, units, and annotations. Provide a clear explanation of what the data represents and what insights can be drawn from it.
Use Interactive Elements
Incorporate interactive elements, such as filters and drill-downs, to allow users to explore the data in more detail. This can help users gain a deeper understanding of the data and identify patterns and trends.
Make it Mobile-Friendly
Ensure your dashboard is accessible on mobile devices. Optimize your visualizations for different screen sizes to provide a seamless user experience.
Advanced Features and Customizations for Your CRM Marketing Dashboard
Once you’ve mastered the basics of setting up your CRM marketing dashboard, you can explore advanced features and customizations to enhance its functionality and effectiveness. Here are some ideas to consider:
Advanced Analytics and Reporting
- Cohort Analysis: Analyze the behavior of groups of customers over time to identify trends and patterns.
- Attribution Modeling: Determine which marketing channels are driving the most conversions.
- Predictive Analytics: Use data to predict future trends and outcomes.
- Custom Reports: Create customized reports that meet your specific needs.
Integration with Other Tools
- Marketing Automation Tools: Integrate your dashboard with your marketing automation platform to track campaign performance and measure ROI.
- Social Media Analytics Tools: Integrate your dashboard with social media analytics tools to track your social media engagement and reach.
- Web Analytics Tools: Integrate your dashboard with web analytics tools to track website traffic and user behavior.
Customization and Branding
- Custom Dashboards: Create custom dashboards for different departments or users.
- Branding: Customize the appearance of your dashboard to match your brand identity.
- Alerts and Notifications: Set up alerts and notifications to be notified of important changes or events.
Troubleshooting Common CRM Marketing Dashboard Issues
Even with careful planning and implementation, you may encounter some common issues when setting up your CRM marketing dashboard. Here’s how to troubleshoot some of them:
Data Accuracy Issues
If you suspect data accuracy issues, check the following:
- Data Sources: Ensure that the data sources are connected correctly and that the data is being pulled in accurately.
- Data Transformations: Review any data transformations that are being applied to the data. Make sure the transformations are correct and are not causing any errors.
- Data Validation: Validate the data by comparing it to other sources or by manually checking the data.
Performance Issues
If your dashboard is running slowly, try the following:
- Optimize Data Queries: Optimize the data queries to improve performance.
- Reduce the Amount of Data: Reduce the amount of data that is being displayed on the dashboard.
- Use Caching: Implement caching to improve the performance of the dashboard.
User Adoption Issues
If users are not adopting your dashboard, try the following:
- Provide Training: Provide comprehensive training to users on how to use the dashboard.
- Gather Feedback: Gather feedback from users to understand their needs and preferences.
- Make it User-Friendly: Make the dashboard as user-friendly as possible.
Conclusion: Harnessing the Power of Your CRM Marketing Dashboard
Setting up a CRM marketing dashboard is a significant step toward improving your marketing performance and achieving your business goals. By following the steps outlined in this guide, you can create a powerful tool that provides valuable insights into your marketing efforts. Remember to clearly define your goals, choose the right CRM platform, identify your key metrics, and visualize your data effectively.
Regularly analyze your dashboard, make data-driven decisions, and continuously optimize your strategies. By harnessing the power of your CRM marketing dashboard, you can stay ahead of the competition, drive growth, and achieve remarkable results. Embrace the power of data, and watch your marketing success soar!

