Unlocking Growth: The Ultimate Guide to CRM Marketing Dashboards
Introduction: Navigating the Data Sea with CRM Marketing Dashboards
In today’s hyper-competitive business landscape, data is the new gold. But raw data, much like unprocessed gold, is useless until refined. This is where Customer Relationship Management (CRM) marketing dashboards come into play. They are the refined gold, the polished gems, that provide actionable insights, turning complex data into clear strategies. This comprehensive guide will delve deep into the world of CRM marketing dashboards, exploring their power, functionality, benefits, and how to build and utilize them effectively. We’ll cover everything from the fundamental components to advanced strategies, ensuring you’re equipped to navigate the data sea and steer your marketing efforts towards success.
Imagine having a clear, concise, and real-time view of your marketing performance. No more guesswork, no more wading through endless spreadsheets. A CRM marketing dashboard provides just that – a centralized hub where all your key metrics are displayed in an easy-to-understand format. It’s a game-changer, allowing you to make informed decisions, optimize campaigns, and ultimately, drive revenue growth.
What is a CRM Marketing Dashboard? Breaking Down the Basics
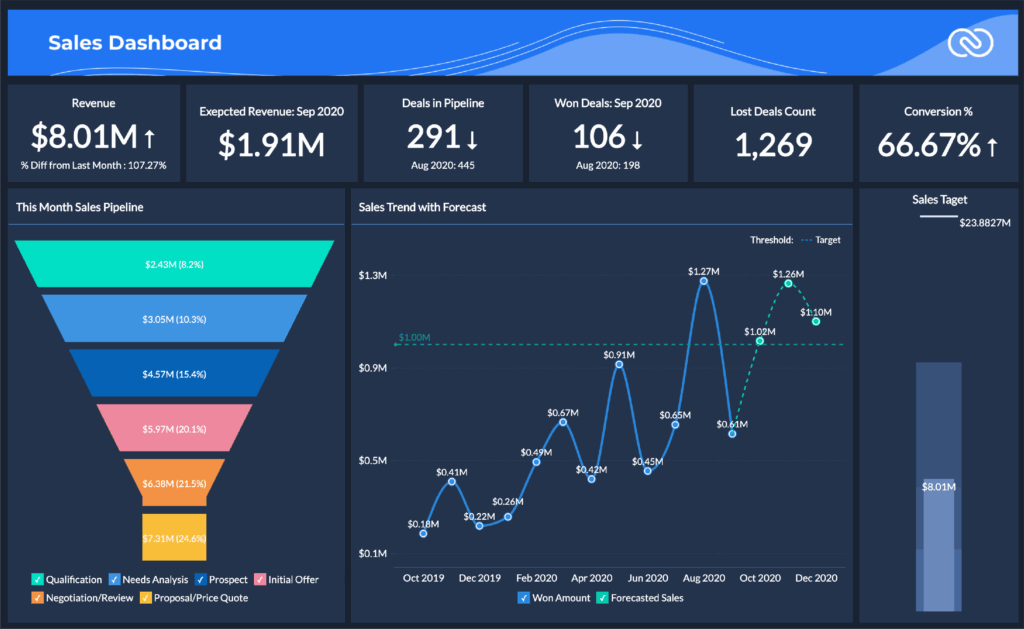
At its core, a CRM marketing dashboard is a visual representation of your marketing data, pulled directly from your CRM system. It’s a dynamic, interactive tool designed to track, analyze, and report on your marketing performance. Think of it as your marketing command center, providing you with instant access to the information you need to make strategic decisions.
Unlike static reports, dashboards are designed to be interactive. You can often drill down into specific metrics, filter data by various criteria, and customize the view to suit your individual needs. This level of flexibility allows you to focus on the most relevant information and gain a deeper understanding of your marketing efforts.
Key components of a CRM marketing dashboard typically include:
- Key Performance Indicators (KPIs): These are the metrics you choose to track, such as website traffic, lead generation, conversion rates, and customer acquisition cost.
- Data Visualization: Charts, graphs, and other visual elements are used to present data in an easily digestible format.
- Real-time Data: Dashboards are often updated in real-time or near real-time, providing you with the most up-to-date information.
- Customization Options: The ability to tailor the dashboard to your specific needs, including selecting the metrics you want to track and customizing the layout.
- Reporting Capabilities: The ability to generate reports based on the data displayed in the dashboard.
By providing a clear and concise overview of your marketing performance, a CRM marketing dashboard empowers you to make data-driven decisions, optimize your campaigns, and ultimately, achieve your marketing goals.
The Power of a CRM Marketing Dashboard: Why You Need One
The benefits of implementing a CRM marketing dashboard are numerous and far-reaching. Here’s why you need one:
1. Improved Decision-Making
Data-driven decisions are the cornerstone of successful marketing. A CRM marketing dashboard provides you with the insights you need to make informed decisions, eliminating guesswork and intuition. You can quickly identify what’s working, what’s not, and make adjustments accordingly.
For example, if your dashboard reveals a low conversion rate on a specific landing page, you can quickly investigate the issue and make changes to improve the user experience, refine your messaging, or optimize your call to action.
2. Enhanced Campaign Optimization
By tracking key metrics, you can monitor the performance of your marketing campaigns in real-time. This allows you to identify areas for improvement and optimize your campaigns for better results. You can adjust your targeting, refine your messaging, or allocate your budget more effectively.
For instance, if your dashboard shows that a particular ad campaign is generating a high number of leads but a low conversion rate, you can analyze the campaign’s performance and make adjustments to improve its effectiveness.
3. Increased Efficiency and Productivity
A CRM marketing dashboard streamlines your reporting process, saving you valuable time and resources. Instead of manually compiling data from various sources, you can access all your key metrics in one centralized location. This frees up your time to focus on more strategic tasks, such as developing new campaigns and analyzing customer behavior.
No more endless hours spent creating spreadsheets and reports. With a dashboard, you can quickly and easily track your progress, identify trends, and make data-driven decisions.
4. Better Customer Understanding
CRM marketing dashboards often integrate data from various sources, providing a holistic view of your customers. This allows you to gain a deeper understanding of their behavior, preferences, and needs. You can use this information to personalize your marketing efforts and create more targeted campaigns.
By analyzing customer data, you can identify segments, personalize messaging, and tailor your offers to increase engagement and conversions.
5. Improved Collaboration and Communication
Dashboards provide a shared view of marketing performance, making it easier for teams to collaborate and communicate. Everyone has access to the same information, fostering transparency and alignment. This can lead to better decision-making and improved results.
Sharing a dashboard with your team ensures everyone is on the same page, working towards the same goals, and understanding the overall impact of their efforts.
Key Metrics to Track in Your CRM Marketing Dashboard
The specific metrics you track in your CRM marketing dashboard will depend on your business goals and marketing objectives. However, some key metrics are essential for any marketing team. These include:
1. Website Traffic
Tracking website traffic is crucial for understanding the overall performance of your marketing efforts. Key metrics to track include:
- Total Website Visits: The total number of times users have visited your website.
- Unique Visitors: The number of individual users who have visited your website.
- Pageviews: The total number of pages viewed on your website.
- Bounce Rate: The percentage of visitors who leave your website after viewing only one page.
- Average Session Duration: The average time visitors spend on your website.
Analyzing these metrics can help you understand how well your website is attracting and engaging visitors.
2. Lead Generation
Lead generation is a critical component of any marketing strategy. Key metrics to track include:
- Number of Leads Generated: The total number of leads generated through your marketing efforts.
- Lead Conversion Rate: The percentage of leads that convert into customers.
- Cost Per Lead (CPL): The cost of generating a single lead.
- Lead Source: The source of your leads (e.g., website, social media, email).
Tracking these metrics helps you measure the effectiveness of your lead generation efforts.
3. Sales and Conversion
Ultimately, the goal of marketing is to drive sales and conversions. Key metrics to track include:
- Conversion Rate: The percentage of leads that convert into customers.
- Sales Revenue: The total revenue generated from sales.
- Customer Acquisition Cost (CAC): The cost of acquiring a new customer.
- Average Order Value (AOV): The average amount spent per order.
- Customer Lifetime Value (CLTV): The predicted revenue a customer will generate throughout their relationship with your business.
Monitoring these metrics helps you understand the impact of your marketing efforts on your bottom line.
4. Email Marketing Performance
Email marketing remains a powerful tool for engaging with customers and driving conversions. Key metrics to track include:
- Open Rate: The percentage of emails that are opened.
- Click-Through Rate (CTR): The percentage of recipients who click on links in your email.
- Conversion Rate: The percentage of recipients who convert after clicking on a link in your email.
- Unsubscribe Rate: The percentage of recipients who unsubscribe from your email list.
Analyzing these metrics helps you optimize your email marketing campaigns for better results.
5. Social Media Engagement
Social media is an essential channel for reaching and engaging with your audience. Key metrics to track include:
- Follower Growth: The rate at which your followers are growing.
- Engagement Rate: The percentage of your followers who are interacting with your content (e.g., likes, comments, shares).
- Reach: The number of unique users who have seen your content.
- Click-Through Rate (CTR): The percentage of users who click on links in your social media posts.
Monitoring these metrics helps you understand the effectiveness of your social media efforts.
Building Your CRM Marketing Dashboard: A Step-by-Step Guide
Creating a CRM marketing dashboard may seem daunting, but with a clear plan and the right tools, it’s a manageable process. Here’s a step-by-step guide to help you get started:
1. Define Your Goals and Objectives
Before you start building your dashboard, you need to define your goals and objectives. What do you want to achieve with your marketing efforts? What key metrics are most important to track? This will help you determine which data to include in your dashboard.
For example, if your goal is to increase lead generation, you’ll want to track metrics such as the number of leads generated, lead conversion rate, and cost per lead.
2. Choose Your CRM and Dashboarding Tools
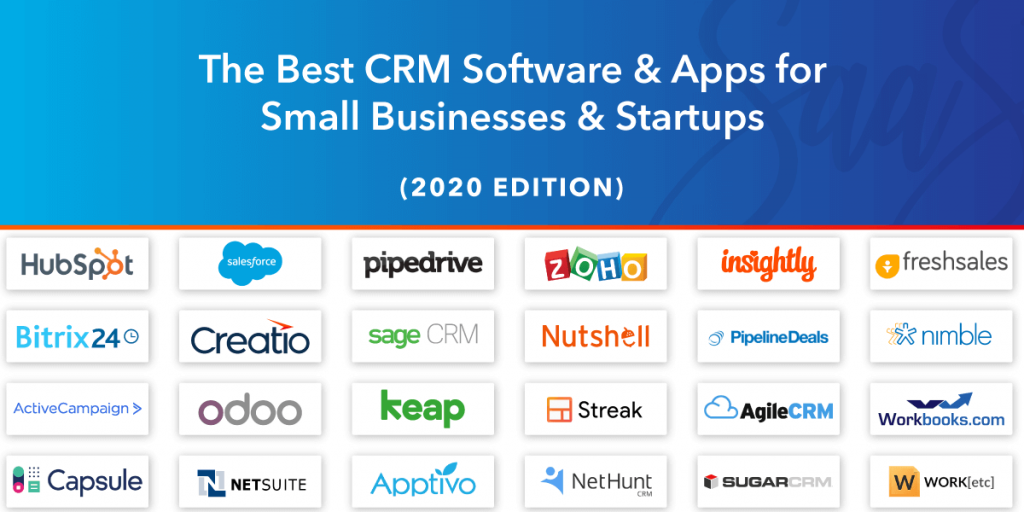
Select a CRM system that meets your business needs. Popular options include Salesforce, HubSpot, Zoho CRM, and Pipedrive. Then, choose a dashboarding tool that integrates with your CRM and allows you to create custom dashboards. Some options include:
- Built-in CRM Dashboards: Many CRM systems offer built-in dashboarding capabilities.
- Dedicated Dashboarding Tools: Tools like Google Data Studio (now Looker Studio), Tableau, and Power BI provide more advanced features and customization options.
Consider factors such as ease of use, data visualization capabilities, and integration with your existing tools when choosing your tools.
3. Connect Your Data Sources
Once you’ve chosen your tools, you’ll need to connect your data sources. This typically involves integrating your CRM system with your dashboarding tool. You may also need to connect other data sources, such as your website analytics platform (e.g., Google Analytics), social media accounts, and email marketing platform.
Most dashboarding tools offer pre-built connectors for popular data sources, making the integration process relatively straightforward.
4. Select and Organize Your Metrics
Choose the key metrics you want to track based on your goals and objectives. Organize your metrics logically, grouping related metrics together. This will make it easier to understand the data and identify trends.
For example, you might group website traffic metrics (e.g., website visits, bounce rate) together and lead generation metrics (e.g., number of leads, lead conversion rate) together.
5. Design Your Dashboard
Design your dashboard with clarity and usability in mind. Use charts, graphs, and other visual elements to present data in an easily digestible format. Choose colors and fonts that are easy on the eyes and consistent with your brand.
Consider the layout of your dashboard. Arrange the most important metrics at the top and group related metrics together. Make sure the dashboard is easy to navigate and understand.
6. Test and Refine
Once you’ve built your dashboard, test it thoroughly to ensure that the data is accurate and the visualizations are clear. Get feedback from your team and make adjustments as needed. Continue to refine your dashboard over time, adding new metrics and visualizations as your needs evolve.
Regularly review your dashboard and make adjustments to ensure it’s providing the insights you need to make informed decisions.
Advanced Strategies: Taking Your CRM Marketing Dashboard to the Next Level
Once you’ve mastered the basics, you can take your CRM marketing dashboard to the next level with these advanced strategies:
1. Segmentation and Filtering
Segment your data to gain deeper insights into specific customer groups or marketing campaigns. Use filters to drill down into the data and analyze performance by various criteria, such as:
- Customer Demographics: Age, location, income.
- Purchase History: Previous purchases, order value.
- Marketing Channel: Email, social media, paid advertising.
- Campaign Performance: Specific campaigns, ad sets.
Segmentation and filtering allows you to uncover hidden patterns and tailor your marketing efforts to specific customer segments.
2. Predictive Analytics
Leverage predictive analytics to forecast future trends and anticipate customer behavior. Use data to predict:
- Lead Conversion Rates: Identify leads most likely to convert.
- Customer Churn: Predict which customers are at risk of churning.
- Sales Forecasts: Project future sales based on historical data.
Predictive analytics can help you proactively address potential issues and optimize your marketing strategies.
3. Integration with Other Tools
Integrate your CRM marketing dashboard with other tools to gain a more comprehensive view of your marketing performance. Integrate with:
- Marketing Automation Platforms: Automate tasks and personalize customer interactions.
- Social Media Management Tools: Track social media engagement and brand mentions.
- Customer Feedback Tools: Gather customer feedback and measure satisfaction.
Integrating your dashboard with other tools can streamline your workflows and provide a more holistic view of your marketing efforts.
4. Automation and Alerts
Automate your dashboard to save time and ensure you’re always up-to-date on your marketing performance. Set up alerts to notify you of significant changes or anomalies in your data. Automate:
- Data Updates: Automatically refresh data from your CRM and other sources.
- Performance Alerts: Receive notifications when key metrics change.
- Report Generation: Schedule automated reports to be sent to your team.
Automation and alerts help you stay informed and proactive in your marketing efforts.
5. Customization and Personalization
Customize your dashboard to meet the specific needs of your team and stakeholders. Personalize the dashboard to provide each user with the information they need to perform their jobs effectively. Customize:
- User Roles and Permissions: Grant access to specific metrics and data based on user roles.
- Dashboard Views: Create different views for different teams or departments.
- Reporting Templates: Develop custom reporting templates for specific use cases.
Customization and personalization can significantly improve the usability and effectiveness of your dashboard.
Troubleshooting Common CRM Marketing Dashboard Issues
Even with the best intentions, you might encounter some challenges when building and using a CRM marketing dashboard. Here’s how to troubleshoot common issues:
1. Data Accuracy Issues
Ensure the data in your dashboard is accurate and reliable. Verify that your CRM system and other data sources are properly integrated and that data is being collected and updated correctly. Check for:
- Data Duplicates: Clean up any duplicate data in your CRM.
- Missing Data: Ensure all necessary data fields are populated.
- Data Errors: Correct any data entry errors.
Regularly audit your data to ensure accuracy and reliability.
2. Slow Dashboard Performance
If your dashboard is slow to load or update, it can frustrate users and hinder decision-making. Optimize your dashboard for performance by:
- Limiting the Number of Metrics: Focus on the most important metrics.
- Optimizing Data Queries: Improve the efficiency of your data queries.
- Using Data Aggregation: Aggregate data to reduce the amount of data being displayed.
Performance optimization can improve the user experience and make your dashboard more effective.
3. Lack of User Adoption
If your team isn’t using the dashboard, it’s a waste of time and resources. Encourage user adoption by:
- Training and Education: Provide training on how to use the dashboard and interpret the data.
- Clear Communication: Communicate the benefits of the dashboard and how it can help them.
- User Feedback: Encourage users to provide feedback and make improvements to the dashboard.
User adoption is crucial for the success of your CRM marketing dashboard.
4. Integration Problems
Ensure your CRM system and other data sources are properly integrated with your dashboarding tool. Troubleshoot integration problems by:
- Verifying Connections: Double-check the connections between your data sources and the dashboarding tool.
- Testing Data Flows: Test the data flow to ensure data is being transferred correctly.
- Seeking Technical Support: Contact the dashboarding tool’s support team for assistance.
Proper integration is essential for the accuracy and reliability of your dashboard.
Conclusion: Embracing the Power of CRM Marketing Dashboards
CRM marketing dashboards are an indispensable tool for modern marketers. They empower you to make data-driven decisions, optimize your campaigns, and drive revenue growth. By understanding the fundamentals, implementing the right strategies, and troubleshooting common issues, you can unlock the full potential of your CRM marketing dashboard and transform your marketing efforts.
Remember, a well-designed and effectively utilized CRM marketing dashboard is not just a tool; it’s a strategic asset. It allows you to see the forest for the trees, providing a clear view of your marketing performance and enabling you to navigate the complex landscape of data and achieve your business goals. Embrace the power of data, and you’ll be well on your way to marketing success.

